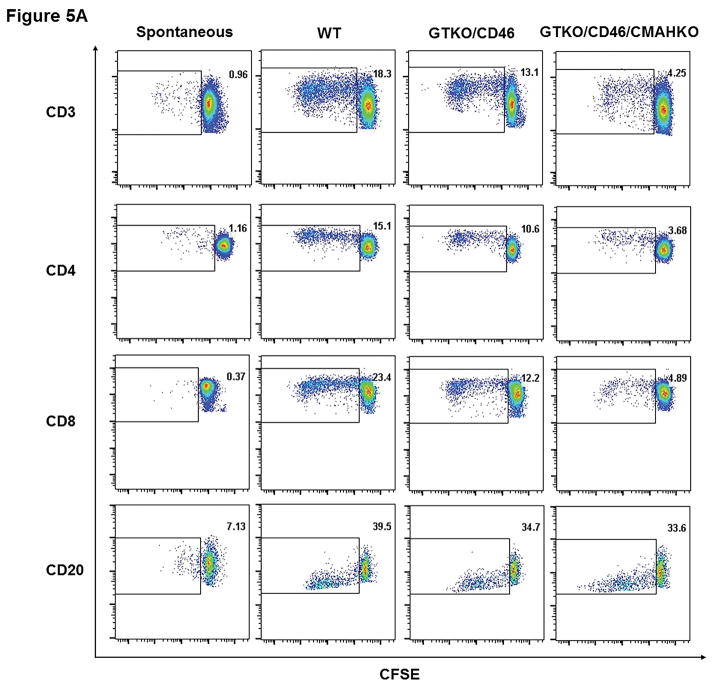
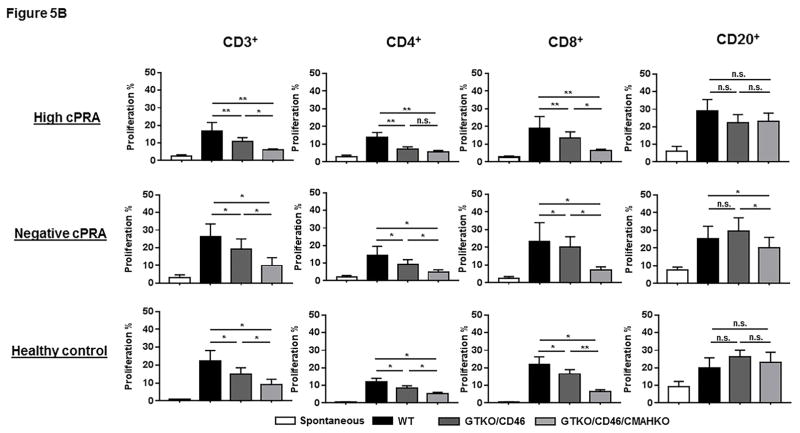
Figure 5.
The response of hPBMC to pPBMC by CFSE-MLR. (A) Representative dot-plot of the proliferation of CD3+, CD4+, CD8+ T cells, and CD20+ cells in hPBMC of a hPRA subject responding to pPBMC from WT, GTKO/CD46, and GTKOCD46/CMAHKO; (B) Percentage proliferation of CD3+, CD4+, CD8+ T cells and CD20+ cells in hPBMC in all study groups responding to pPBMC from WT, GTKO/CD46, and GTKOCD46/CMAHKO pigs was identified and quantified. (n=10 high cPRA subjects responding to WT [n=7] and to GTKO/CD46 and GTKO/CD46/CMAHKO [n=10], n=7 for negative cPRA subjects responding to WT [n=5] and to GTKO/CD46 and GTKO/CD46/CMAHKO [n=7], n=9 for healthy controls responding to WT [n=6] and to GTKO/CD46 and GTKO/CD46/CMAHKO [n=9].) (ns=not significant; *P<0.05, **P<0.01).


