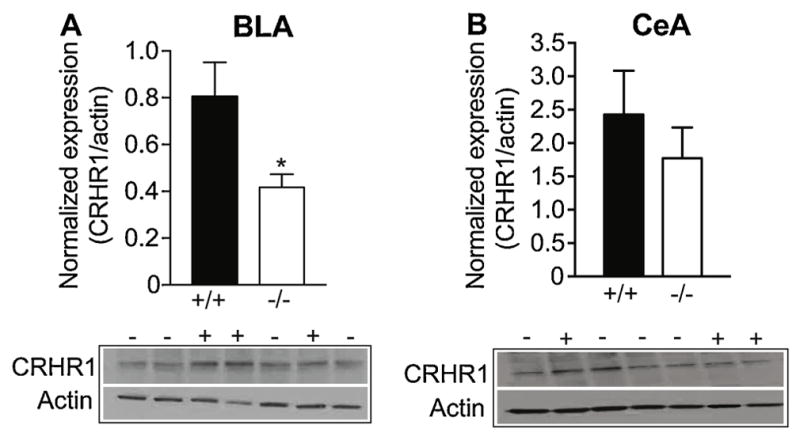
Fig. 4. Reduced CRHR1 protein in the BLA of Lmo3Z mice.

Basolateral (BLA) and central (CeA) amygdala were dissected from the brains of Lmo3Z (−/−, white bars) and wild-type (+/+, black bars) mice for Western Blot analysis. Graphs show the quantification of CRHR1 expression in the A) BLA (n = 9 Lmo3Z and 12 wild-type ) and B) CeA (n = 13 Lmo3Z and 12 wild-type) relative to actin. Representative CRHR1 and actin western blots are shown below each graph. *p < 0.05 by student’s t-test.
