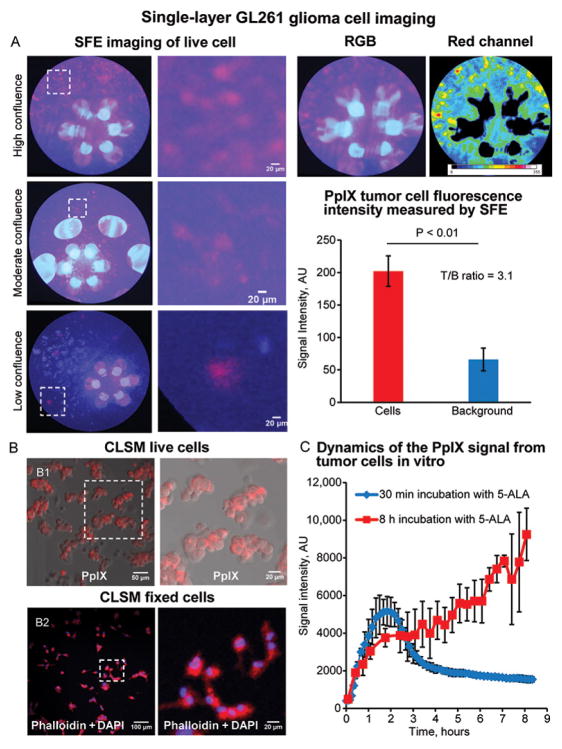
Figure 1.
In vivo protoporphyrin IX (PpIX) imaging of monolayer GL261 cell culture. (A) Scanning fiber endoscope (SFE) images of individual tumor cells in high-, moderate-, and low-cell-density cell cultures. (B) Confocal laser scanning microscope (CLSM) image of the same culture. Live cells (B1) and cells stained with 4′,6-diamidino-2-phenylindole (DAPI) and Alexa Fluor 633 Phalloidin (B2). (C) Graph of PpIX fluorescence measured during time-series live-cell imaging of GL261 cells incubated with 5-aminolevulinic acid (5-ALA). Group one was imaged continuously after treatment with 5-ALA. The second group was treated for 30 minutes, washed with phosphate-buffered saline 3 times, and incubated in media for 8 hours. N=3 for each time point at each group. Data are presented as mean and standard deviation. Used with permission from Barrow Neurological Institute, Phoenix, Arizona.

