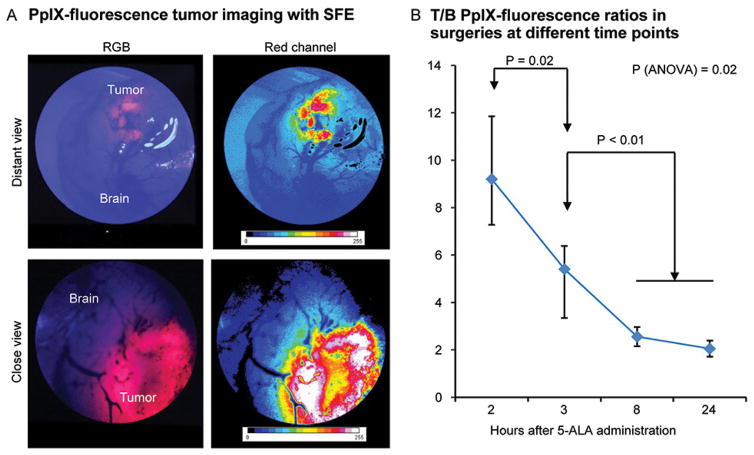
Figure 3.
Protoporphyrin IX (PpIX) detection in tumor with scanning fiber endoscope (SFE). (A) SFE image of mouse brain with tumor visible below cortex. (B) Quantification of tumor PpIX fluorescence at different times after 5-aminolevulinic acid injection (n=3 at 2 h, n=6 at 3 h, n=2 at 8 h, and n=2 at 24 h). Kruskal-Wallis analysis of variance (ANOVA) and Mann-Whitney U tests used for comparisons. Data presented as mean and range. RGB, red, green, blue; T/B, tumor-to-brain. Used with permission from Barrow Neurological Institute, Phoenix, Arizona.

