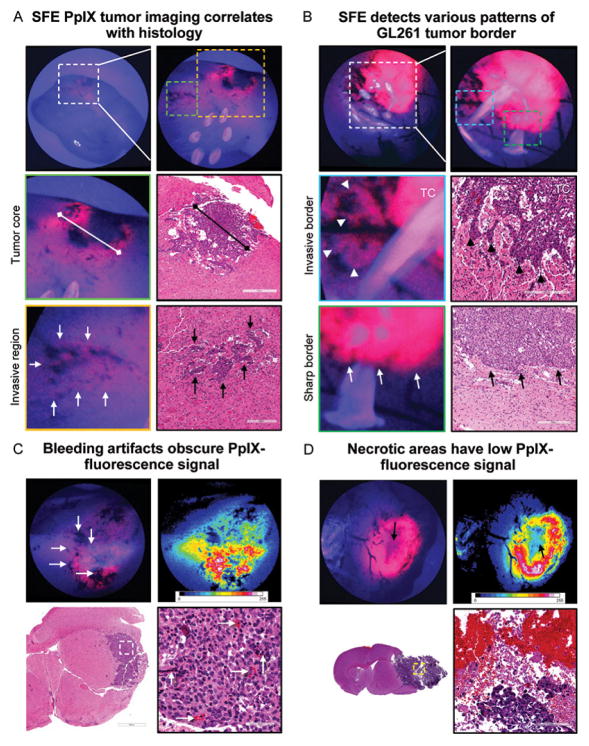
Figure 4.
Tumor border visualized with scanning fiber endoscope (SFE). (A) Representative SFE images of coronal brain cut through tumor core (TC) and correlative hematoxylin-and-eosin (HE)–stained sections. TC size measured on SFE and histological sections matched. Regions of invasion (arrows) are visible as patches of increased protoporphyrin IX (PpIX) signal close to areas of bleeding from abnormal vasculature. The 6 bright circles on the top right-side image are retroreflections from SFE light-collection fibers. (B) Invasive border regions with flames of glioma cells penetrating normal brain (arrowheads) and noninvasive tumor border regions (arrows). (C) HE-stained section demonstrates bleeding points associated with tumor microvasculature (arrows) corresponding to dark spots on SFE. (D) Correlative images illustrate diminished PpIX signal (arrow) at necrotic TC. Used with permission from Barrow Neurological Institute, Phoenix, Arizona.

