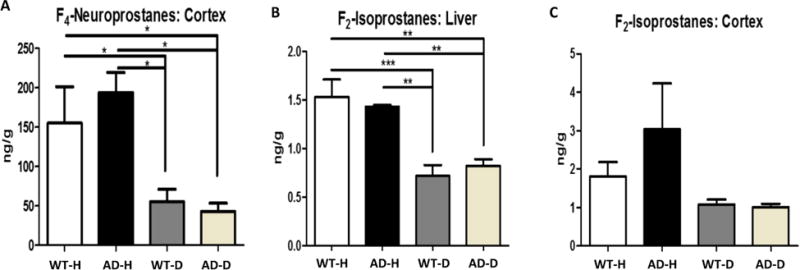
Figure 8.

Mice fed D-PUFA exhibit reductions in levels of lipid peroxidation products in the brain and liver compared to mice fed H-PUFA. (A) Levels of F4-neuroprostanes in cerebral cortical tissue samples from WT and AD mice that had been maintained on H-PUFA or D-PUFA diets for 5 months. (B) Levels of F2-isoprostanes in liver tissue samples from WT and AD mice that had been maintained on H-PUFA or D-PUFA diets for 5 months. (C) Levels of F2-isoprostanes in cerebral cortical tissue samples from WT and AD mice that had been maintained on H-PUFA or D-PUFA diets for 5 months. Values are the mean and SEM of 4 WT mice fed H-PUFA, 5 WT mice fed D-PUFA, 4 AD mice fed H-PUFA and 4 AD mice fed D-PUFA. AD mice on the H-PUFA diet and 13 AD mice on the D-PUFA diet. *p<0.05, **p<0.01, ***p<0.001.
