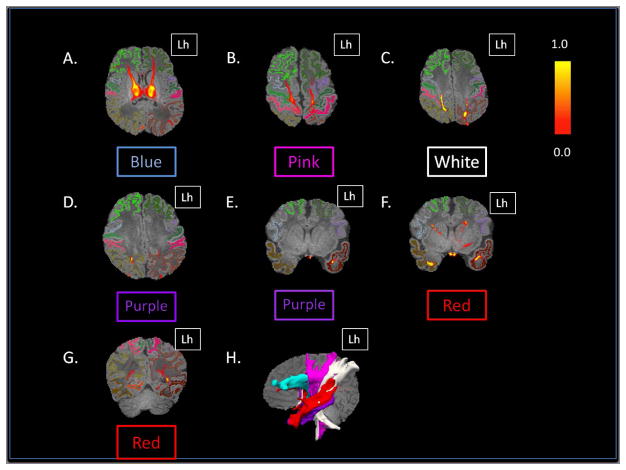
Figure 3.
Probabilistic tractography maps showing the likelihood of connections between each of the clusters and the cortical targets in a TD neonate (TD 4). (A) Axial image shows strong connections of the blue cluster to the prefrontal labels. (B) Axial image shows strong connections from the pink cluster to the premotor labels (gray on the right and purple on the left) and primary motor labels (green labels). (C) Axial image shows strong connections of the white cluster to the primary somatosensory label and the superior aspect the posterior parietal label. (D) Axial and (E) coronal images show strong connections between the purple cluster and the posterior parietal on the right, weaker connections to the posterior parietal on the left, and strong connections to the temporal lobe on the left. (F and G) Coronal images show strong connections of the red clusters to the prefrontal, temporal, and occipital lobes. (H) Sagittal 3D-rendered images of the thresholded probabilistic tracts illustrate the spatial relationship of these tracts in the white matter. Colors correspond to the thalamic ROI that generated the connections. Lh= left hemisphere.

