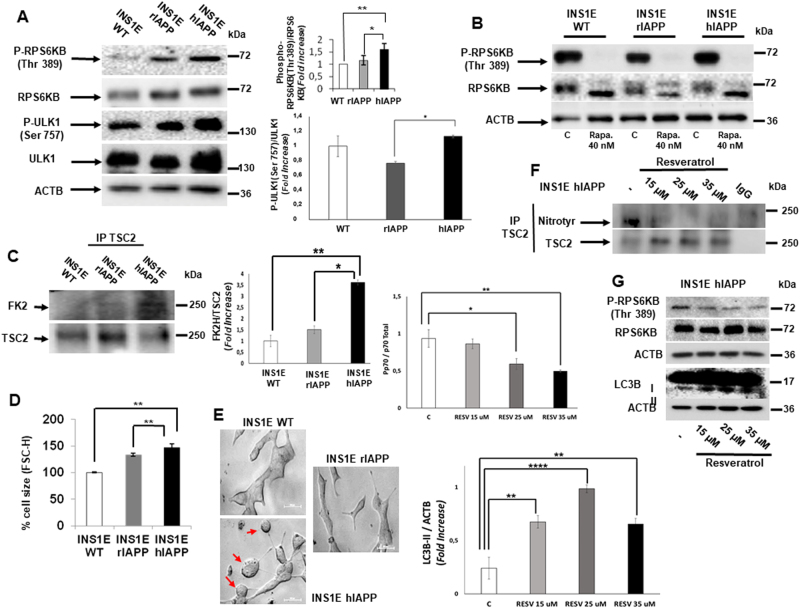
Fig. 1.
Hyperactivation of MTORC1 signaling and cell size increases in INS1E-hIAPP cells. a Cell lysates from INS1E WT, rIAPP, and hIAPP were analyzed by western blotting using the indicated antibodies. Representative blots and the respective quantification of the ratios p-RPS6KB (Thr389)/RPS6KB and p-ULK1 (Ser 757)/ULK1 are shown. ACTB was used as a loading control. Results are representing the fold change of independent experiments ± s.d. (n = 3), *P < 0.05 and **P < 0.01. b Representative western blot image from INS1E WT, rIAPP, and hIAPP cells treated or not with rapamycin (40 nM, 15 h). c Immunoprecipitation of TSC2 and western blot analysis with FK2 antibody from INS1E WT, rIAPP, and hIAPP cells under basal state and its respective quantification of FK2/TSC2 protein expression levels. d Flow-cytometric measurement of cell size. The histogram represents changes in cell size in INS1E WT, rIAPP, and hIAPP. Results are representing the mean percentage of independent experiments ± s.d. (n = 3), **P < 0.01. e Microscopic images from INS1E WT, rIAPP, and hIAPP cells. f Lysates from INS1E-hIAPP cells treated or not with the indicated concentration of resveratrol were submitted to immunoprecipitation of TSC2 followed by western blot analysis with nitrotyrosine antibody. g Representative western blot bands from whole total extracts obtained from INS1E- hIAPP cells treated or not with resveratrol

