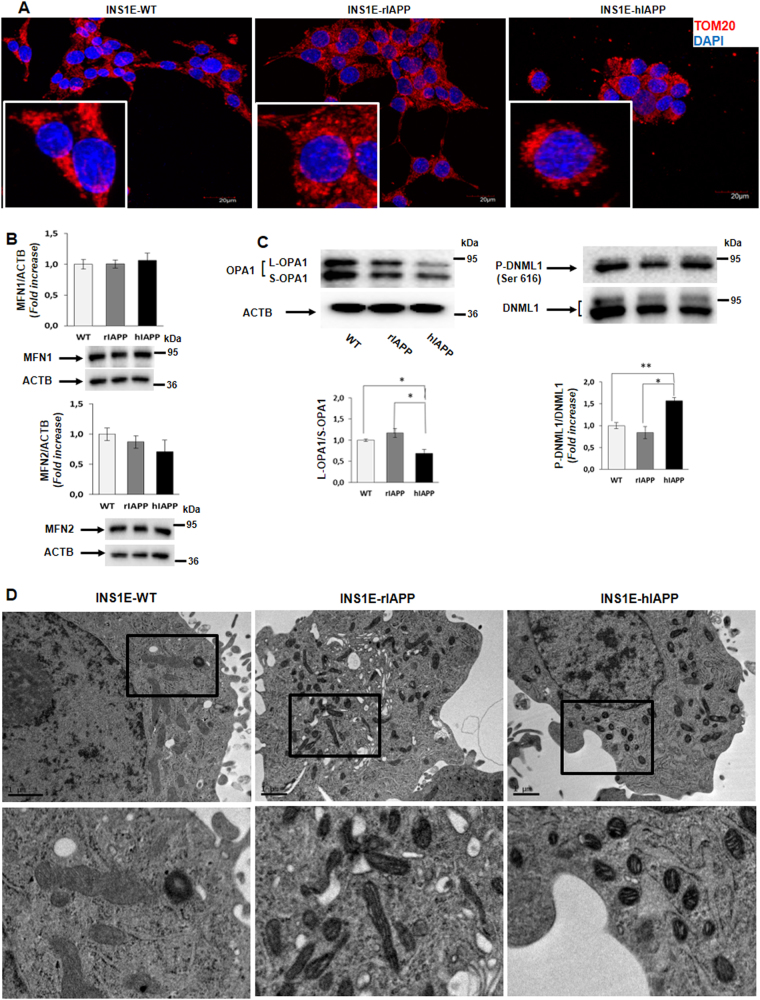
Fig. 4. An increase in fragmented mitochondria was observed in INS1E-hIAPP cells.
a Representative fluorescence microscopy images from INS1E WT, rIAPP, and hIAPP cells using TOMM20 antibody (red) and DAPI (blue). b Histogram representing the fold change in MFN1 and MFN2 protein levels expressed as mean ± s.d. (n = 3). ACTB was used as a loading control. c Representative immunoblot images from INS1E (WT, rIAPP, and hIAPP) cells under basal state and its respective quantification of the fold change in the ratios L-OPA1/S-OPA1 and p-DNML1 (Ser 616)/DNML1 protein levels of independent experiments ± s.d. (n = 3), *P < 0.05, and **P < 0.01. d Representative electron microscope images from INS1E rIAPP and hIAPP cells

