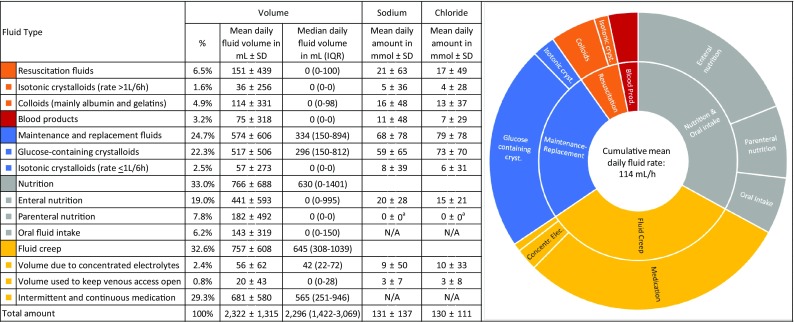
Fig. 1.

Proportion, mean, and median fluid volumes, and mean sodium and chloride burdens of the different fluid types (average of 14,654 patients on their cumulative 103,098 days of ICU stay), including a graphic representation of the distribution of the different mean daily fluid volumes. Mean duration of one ICU day, 20.3 ± 6.7 h. SD standard deviation, IQR interquartile range, N/A data not available. aTo ensure optimal electrolyte management in our ICU, only electrolyte-free formulas of parenteral nutrition are prescribed, with separate administration of electrolytes
