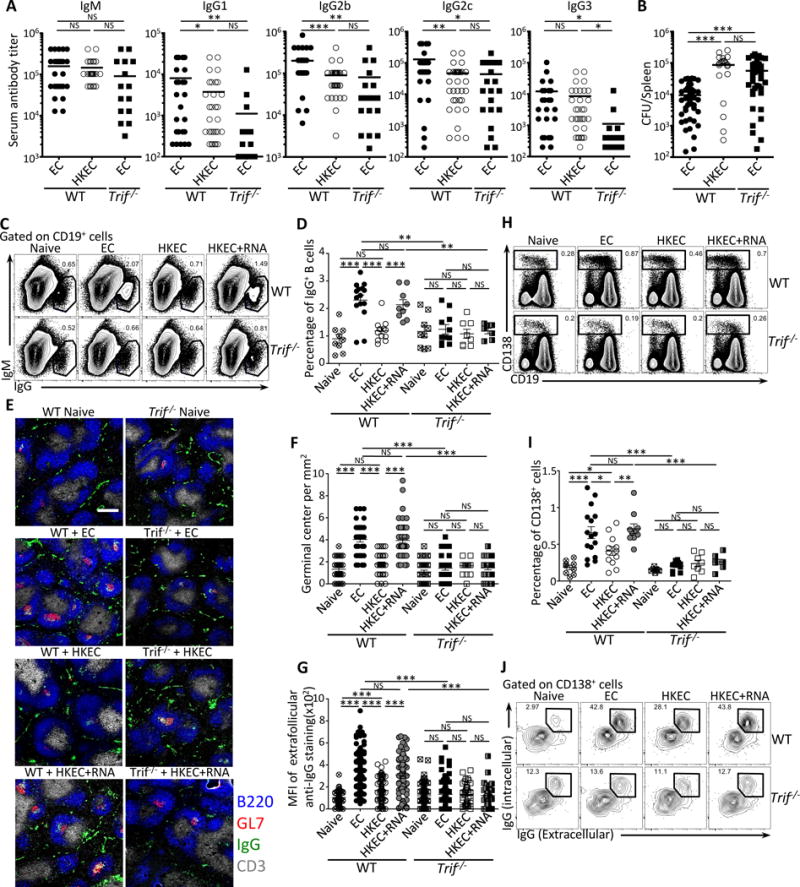
Figure 1. Detection of bacterial viability through TRIF triggers germinal center formation and IgG production.

Wild-type (WT) and Trif−/− mice were vaccinated intraperitoneally with 5×10⁷ live ThyA− EC, heat-killed ThyA− EC (HKEC), or HKEC+RNA(30μg).
(A) Day 25 serum titers of class-specific anti-E. coli (EC) antibodies.
(B) Spleen EC colony forming units (CFU) at 24 hours post-injection of 5×10⁸ live EC into mice vaccinated 6 months earlier.
(C, D) Flow cytometry dot plots (C) and percentages (D) of gated IgG+CD19+ B cells.
(E–G) Immunofluorescence micrographs (E) at 4X magnification on spleen sections stained for B220, GL-7, IgG and CD3. Scale bar = 300 μm. (F) Numbers of germinal centers (GC) per mm2.
(G) Mean fluorescence intensity (MFI) of extra-follicular IgG staining.
(H, I) Flow cytometry dot plots (H) and percentages (I) of gated CD138+ plasma cells and plasmablasts (inclusive of CD19+ plasmablasts and CD19− plasma cells).
(J) Flow cytometry for intracellular and surface IgG expression by CD138+ plasma cells and plasmablasts. Data represent at least 3 independent experiments.
C–J Data in spleens of indicated genotypes before (naïve) and 7 days post-vaccination. (F, G) Each symbol represents one field counted in the scatter plots. (C, H, J) Numbers adjacent to outlined areas indicate percent of cells in gates. Except for (F) and (G), each symbol represents an individual mouse in the scatter plots.
NS, not significant (P > 0.05); *, P<0.05, **, P≤0.01 and ***, P≤0.001 (two-tailed unpaired t test). All data represent at least 3 experiments pooled. Mouse numbers are in (A) WT+EC, n=32; WT+HKEC, n=38; Trif−/−+EC, n=20; (B) WT+EC, n=49; WT+HKEC, n=22; Trif−/−+EC, n=39; (D) WT (naive, n=9 ;+EC, n=15; +HKEC, n=12; +HKEC+RNA, n=9) and Trif−/− (naive, n=9 ;+EC, n=11; +HKEC, n=8; +HKEC+RNA, n=7); (F) and (G) WT (naive, n=4 ;+EC, n=6; +HKEC, n=5; +HKEC+RNA, n=6) and Trif−/− (naive, n=6 ;+EC, n=5; +HKEC, n=4; +HKEC+RNA, n=4); (I) WT (naive, n=9 ;+EC, n=16; +HKEC, n=12; +HKEC+RNA, n=10) and Trif−/− (naive, n=7 ;+EC, n=11; +HKEC, n=8; +HKEC+RNA, n=8).
See also Figure S1.
