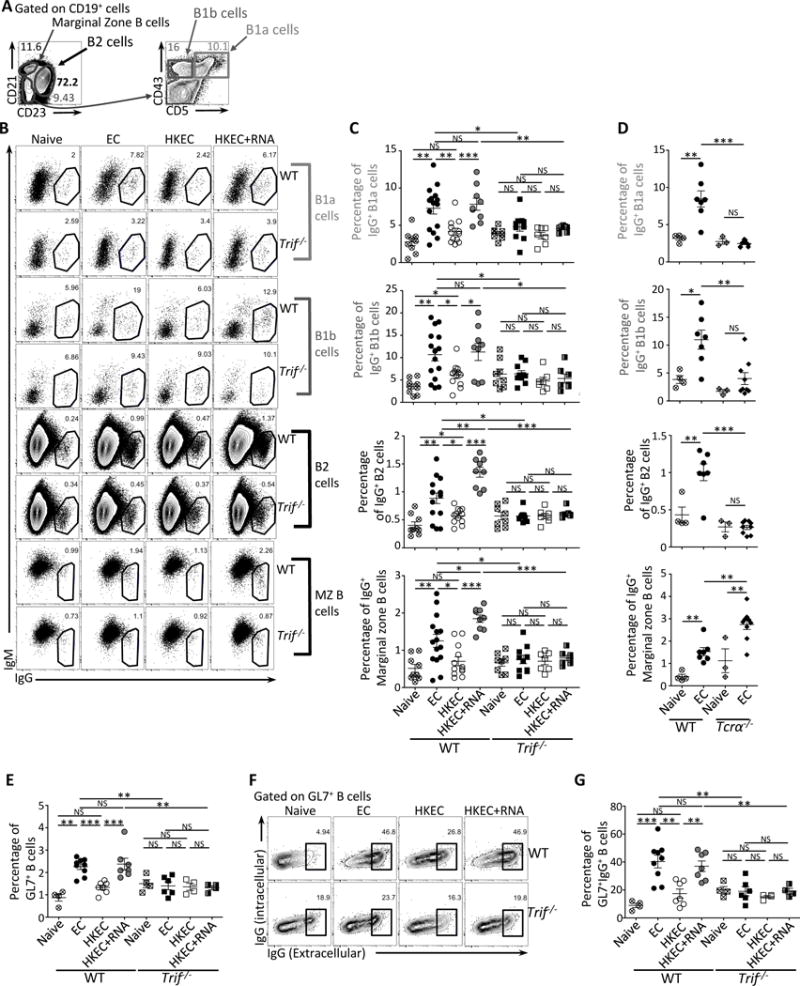
Figure 2. Detection of bacterial viability through TRIF induces immunoglobulin class-switching in all B cell subsets.

Wild-type (WT), Trif−/− and TCRα−/− mice were vaccinated intraperitoneally as indicated with either 5×10⁷ live ThyA− EC, heat-killed ThyA− EC (HKEC), or HKEC+RNA(30μg).
(A) Flow cytometry gating strategy for different B cell populations.
(B, C) Flow cytometry dot plots (B) and percentages (C) of IgG+ B1a, B1b, B2 or marginal zone (MZ) B cells.
(D) Percentages of IgG+ B1a, B1b, B2 or MZ cells identified as in (A).
(E) Percentages of GL7+CD19+ B cells.
(F) Flow cytometry dot plots gated on GL7+CD19+ GC B cells and stained for intracellular and extracellular IgG.
(G) Percentages of IgG+ cells within GL7+CD19+ B cells.
(B–G) Data in spleens of indicated genotypes before (naïve) and 7 days post vaccination. C, D, E and G, each symbol represents an individual mouse in the scatter plots.
NS, not significant (P > 0.05); *, P<0.05, **, P≤0.01 and ***, P≤0.001 (two-tailed unpaired t test). For each scatter plot, the bar indicates the mean±s.e.m. Numbers adjacent to outlined areas indicate percent of cells in gates. Each symbol represents an individual mouse in scatter plots. Data represent at least 3 experiments pooled. Mouse numbers are in (C) WT(naive, n=9 ;+EC, n=15; +HKEC, n=12; +HKEC+RNA, n=9) and Trif−/−(naive, n=8 ;+EC, n=10; +HKEC, n=7; +HKEC+RNA, n=7); (D) WT(naive, n=4 ;+EC, n=7) and Tcrα−/−(naive, n=3 ;+EC, n=9); (E) and (G) WT(naive, n=4 ;+EC, n=9; +HKEC, n=7; +HKEC+RNA, n=7) and Trif−/−(naive, n=4 ;+EC, n=6; +HKEC, n=4; +HKEC+RNA, n=4).
See also Figure S2 and Tables S1 and S2.
