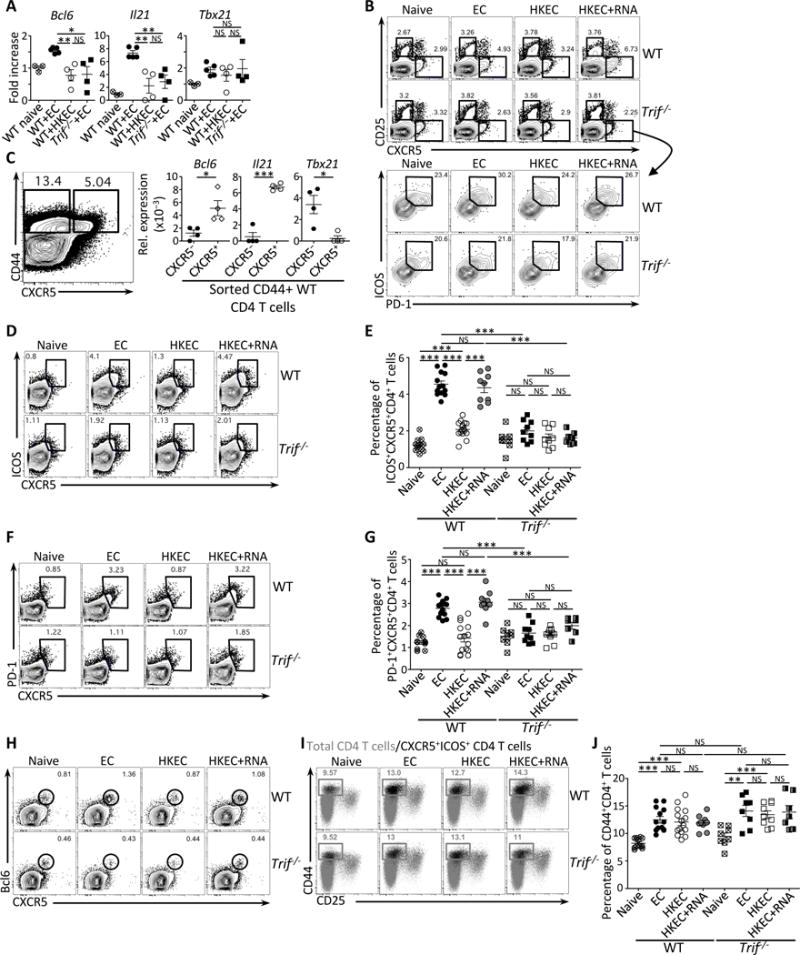
Figure 3. TRIF-dependent detection of bacterial viability promotes Tfh cell differentiation.

Wild-type (WT) and Trif−/− mice were vaccinated intraperitoneally as indicated with either 5×10⁷ live ThyA− EC, heat-killed ThyA− EC (HKEC), or HKEC+RNA(30μg).
(A) Quantitative RT-PCR for Bcl6, Il21 and Tb×21 transcripts in total CD4+ T cells on day 5 after vaccination. Fold increase over naïve mice is shown.
(B) Flow cytometry dot plots gated on CD4+ T cells showing expression for CD25 and CXCR5 (upper panels), and ICOS and PD-1 within gated CXCR5+ T cells (lower panel).
(C) Quantitative RT-PCR for Bcl6, Il21 and Tbx21 transcripts in sorted CD44+CD4+ T cells either CXCR5− (left contour plot) or CXCR5+ (right contour plot). Data represent relative expression to β-actin.
(D, E) Flow cytometry dot plots (D) and percentages (E) of CXCR5+ICOS+CD4+ T cells.
(F, G) Flow cytometry dot plots (F) and percentages (G) of CXCR5+PD-1+CD4+ T cells.
(H) Flow cytometry dot plots for CXCR5 and Bcl6 gated on CD4+ T cells.
(I) Flow cytometry of CD44+CD25−CD4+ T cells. Gray dots represent the total CD4+ T cell population; black dots represent the CXCR5+ICOS+CD4+ T cell population.
(J) Percentages of total CD44+CD4+ T cells.
(B–J) Data for CD4+ T cells in spleens of indicated genotypes before and 5 days post vaccination. Each symbol represents an individual mouse in scatter plots.
NS, not significant (P > 0.05); *, P<0.05, **, P≤0.01and ***, P≤0.001 (two-tailed unpaired t test). Data are mean±s.e.m. Numbers adjacent to outlined areas indicate percent of cells in gates. Data are representative of at least 3 independent experiments. Mouse numbers are in (E), (G) and (J) WT (naive, n=11; +EC, n=13; +HKEC, n=15; +HKEC+RNA, n=9) and Trif−/− (naive, n=8; +EC, n=9; +HKEC, n=9; +HKEC+RNA, n=7).
See also Figure S3.
