
Extended Data Figure 7. Ptpn2-null tumours have increased effector T cell populations, but no other significant differences in immune infiltrates compared with control tumours were found.
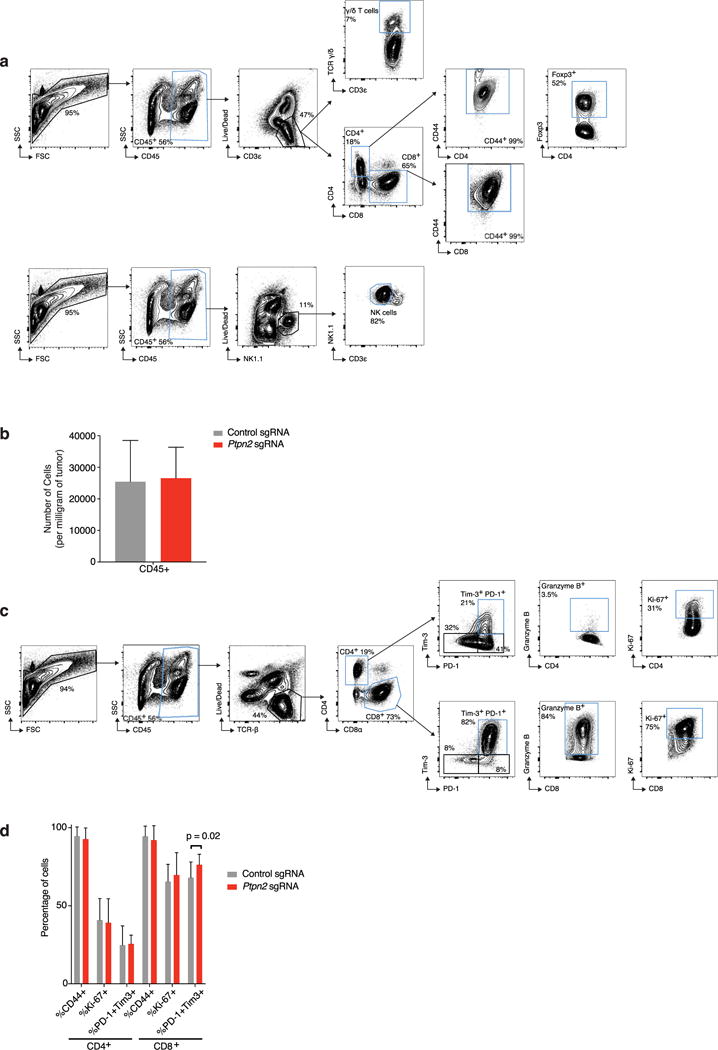
a, Representative plots showing the gating strategy for the data shown in Fig. 4a. Populations of interest are gated in blue. b, The number of CD45+ cells per mg of tumour for Ptpn2-null (red) and control (grey) B16 tumours. Data are mean ± s.d. c, Representative plots showing the gating strategy for the quantification of T cell populations from Ptpn2-null and control B16 tumours shown in d. Populations of interest are gated in blue. d, Quantification of effector T cell populations in either Ptpn2-null or control B16 tumours. Data mean ± s.d. Data pooled from two independent experiments with a minimum of eight mice per group.