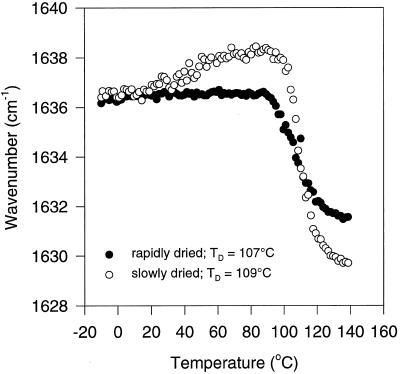
Figure 3.
Wave number-versus-temperature plots (FTIR) of the amide-I band denoting turn and β-sheet protein structures of slowly and rapidly dried carrot somatic embryos (both 0.055 g water/g dry weight). Data of four individual embryos were averaged. Td values were calculated with the help of first-derivative analysis of the curve fitted through the data.

