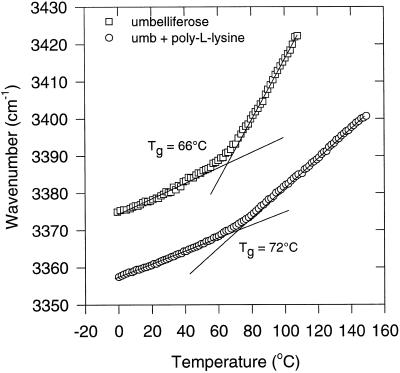
Figure 8.
Wave number-versus-temperature plot (FTIR) of the OH-stretching vibration band of dry umbelliferose and of an umbelliferose/poly-l-Lys glass (0.25 mg poly-l-Lys/mg umbelliferose [umb]). Tg values were determined from the intersection points of the regression lines in the liquid and glassy states.

