
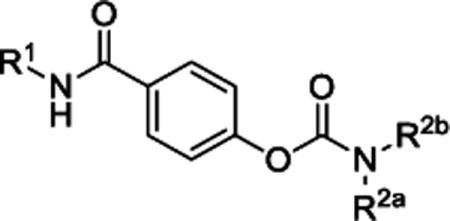
Table 2.
Optimization of carbamate alkyl substituents.
| ||||||||
|---|---|---|---|---|---|---|---|---|
| # | R1 | R2a | R2b | IC50, mean (μM) pIC50, mean (95% CI) % control at 10 μM, mean (99% CI) |
N | |||
| GluN2A | GluN2B | GluN2C | GluN2D | |||||
| 2 |

|
Et | Et | 83 (61,106) | 172 −3.82 (−4.00,−3.64) 82 (77,86) |
6.7 −5.21 (−5.33,−5.10) 35 (27,42) |
5.0 −5.38 (−5.49, −5.27) 27 (21,33) |
7-21 |
| 14 |

|
Et | Et | 5170 −2.36 (−2.58,−2.13) 93 (88,98) |
3010 −2.69 (−2.97,2.41) 91 (87,95) |
3.7 −5.45 (−5.54,5.37) 24 (18,31) |
2.2 −5.68 (−5.74, −5.61) 15 (10,20) |
12 |
| 15 |

|
Me | Me | 99 (65,132) | 900 −3.07 (−3.21,−2.93) 95 (91,99) |
95 (89,100) | 197 −3.73 (−3.86, −3.60) 86 (80,92) |
4-8 |
| 16 |
|
Me | Et | 98 (72,124) | 86 (68,103) | 71 −4.17 (−4.28,−4.05) 85 (82,89) |
52 −4.31 (−4.44, −4.18) 81 (78,84) |
4-8 |
| 17 |

|
iPr | iPr | 95 (89,102) | 2610 −3.75 (−3.98,−3.53) 85 (79,92) |
18 −4.99 (−5.25,−4.72) 41 (27,55) |
5.6 −5.30 (−5.44, −5.16) 31 (21,40) |
12-14 |
| 18 |

|
CH2CH=CH2 | 99 (91,106) | 893 −3.13 (−3.65,−2.80) 90 (85,96) |
68 −4.39 (−4.70,−4.09) 69 (59,80) |
49 −4.35 (−4.53,-4.18) 67 (61,73) |
4-8 | |
| 19 |

|
-CH2CH2CH2CH2- | 93 (56,131) | 90 (68,113) | 170 −3.82 (−4.24,−3.41) 88 (86,91) |
267 −3.59 (−3.79,−3.39) 88 (80,95) |
4 | |
| 20 |

|
-CH2CH2CH2CH2CH2- | 94 (80,109) | 98 (86,110) | 92 (70,115) | NF 86 (80,91) | 4-8 | |
| 21 |

|
(CH2)3CH3 | 100 (94,106) | 98 (96,105) | 95 (94,100) | NF 93 (88,99) | 4 | |
Current responses to 100 μM glutamate and 30 μM glycine co-applied with increasing concentrations of compound were recorded in Xenopus oocytes expressing GluN1 with GluN2A, GluN2B, GluN2C, or GluN2D. The data were fit by the Hill equation, unless the 99% CI of the mean percent maximal response at 10 μM included 100%. NF: the 99% CI did not include 100%, but the data could not be fit by the Hill equation. Data for compounds 2 and 14, shown in Table 1, are included here for comparison.