
Figure 2.
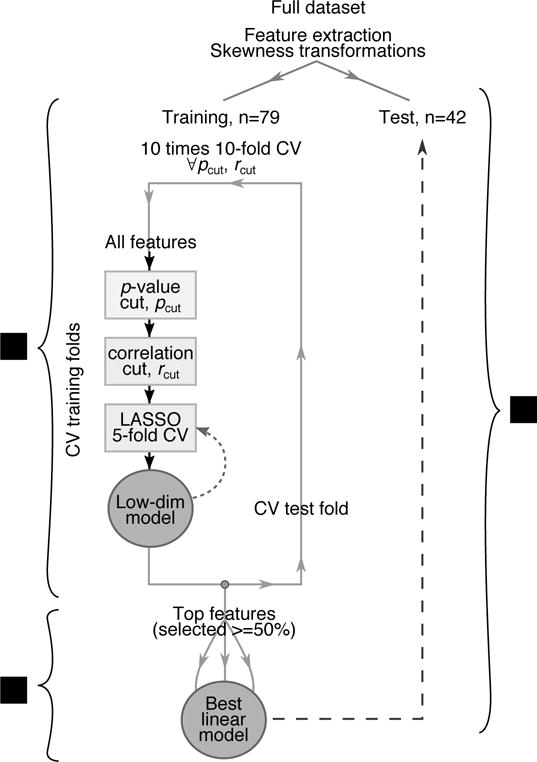
Flow chart of the steps followed to derive the predictive model, including (1) feature selection, (2) model building, and (3) testing. The curved, dashed line indicates the addition of interaction terms between the selected features to assess the importance of non-linearity.