
Figure 4.
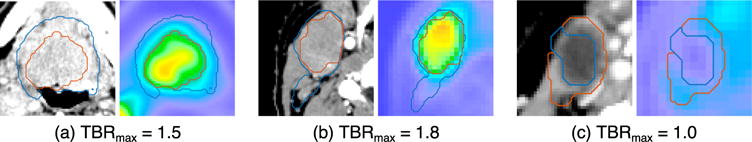
Representative slices from the CT and 18F-FDG PET scans of three lesions with a diverse range of radiomics features and TBRmax. Each subfigure corresponds to a different lesion, with the CT scan on the left panel and the 18F-FDG PET scan on the right panel. The main features for each lesion are: (a) TBRmax=1.5, =35 cc, =9735, =18.2, =0.48; (b) TBRmax=1.8, =6 cc, =10980, =11.5, = 0.17; (c) TBRmax=1.0, =0 cc, =5702, =1.9, =0.65. The white contour indicates v↓, and the dark grey contour indicates v↑.