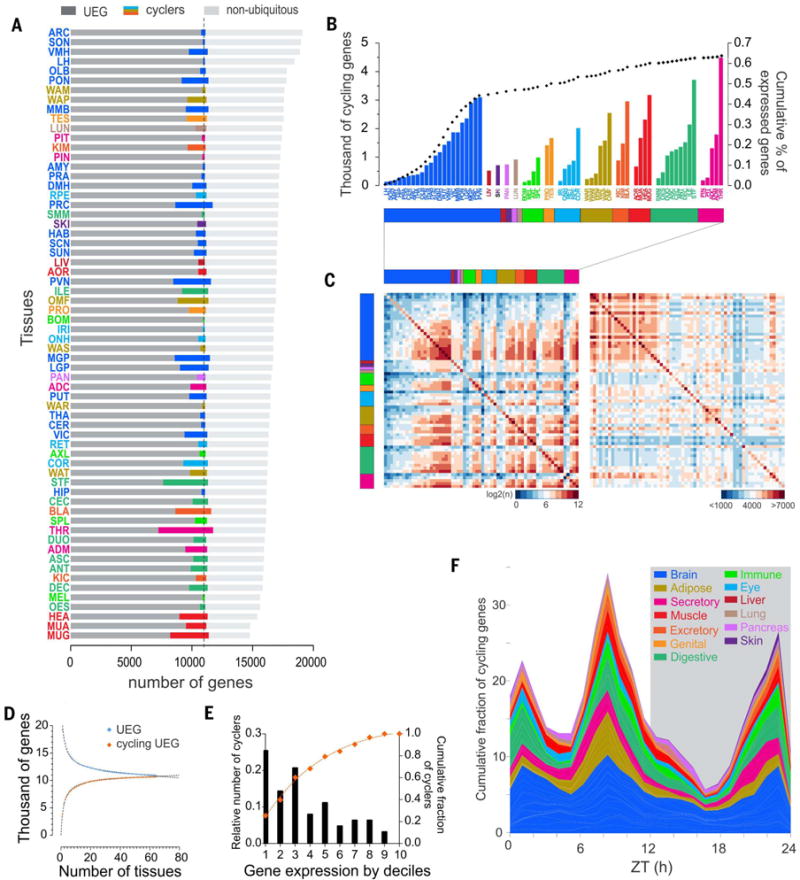
Fig. 3. Rhythmic gene expression across tissues.

(A) Number of rhythmic genes (colored bars) and their distribution in each tissue between the pool of genes expressed in all tissues (UEGs, dark gray) and the pool of genes expressed more specifically (light gray). (B) Rhythmic identity. Shown are the number of cycling genes per tissue (grouped according to type) and their relative contribution to the total pool of genes (dotted black line). (C) Tissue by tissue of the overlap of the cycling genes (left) and of expressed genes (right).The color coding represents the degree of the overlap: from blue, few common genes, to red, high number of shared genes [on the left, log2 (common cycling genes), and on the right <1000 to >7000 commonly expressed genes (excluding UEGs)]. Raw data is provided in table S6. (D) Number of UEGs and rhythmic UEGs detected as a function of the number of tissues sampled. Best-fit function is overlaid (R2 = 0.9909 and 0.9944, respectively) (E) Weights of rhythmic transcription. Shown is distribution according to deciles of expressed genes (from most expressed to least expressed) indicating where the highest proportion of rhythmic genes are located. The curve indicates the cumulative fraction of cycling genes according to their level of expression. (F) Cumulative distribution of the peak phases of gene expression in the different tissues (grouped by systems and functions) throughout the day–night cycle. Peak phases of gene expression were normalized to the maximum in each tissue.
