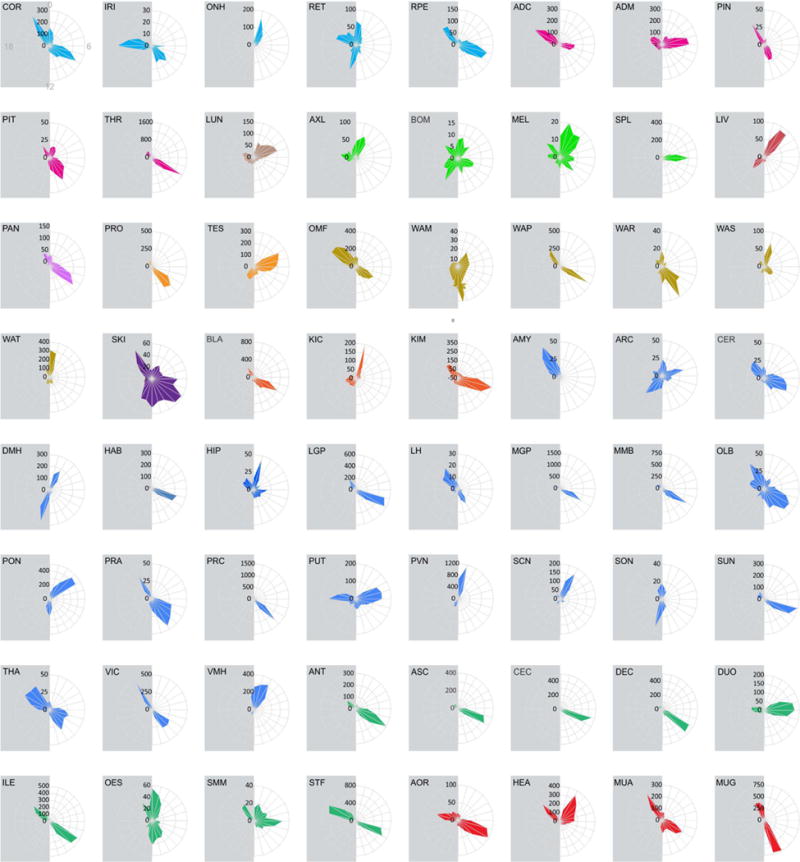
Fig. 4. Tissue-specific rhythmic gene expression.

Radial plot of the distribution of the peak phase of expression of the cycling genes in each of the 64 tissues of the present atlas. On the first plot, gray indicates ZT, and number of gene peaks of expression are listed in black.
