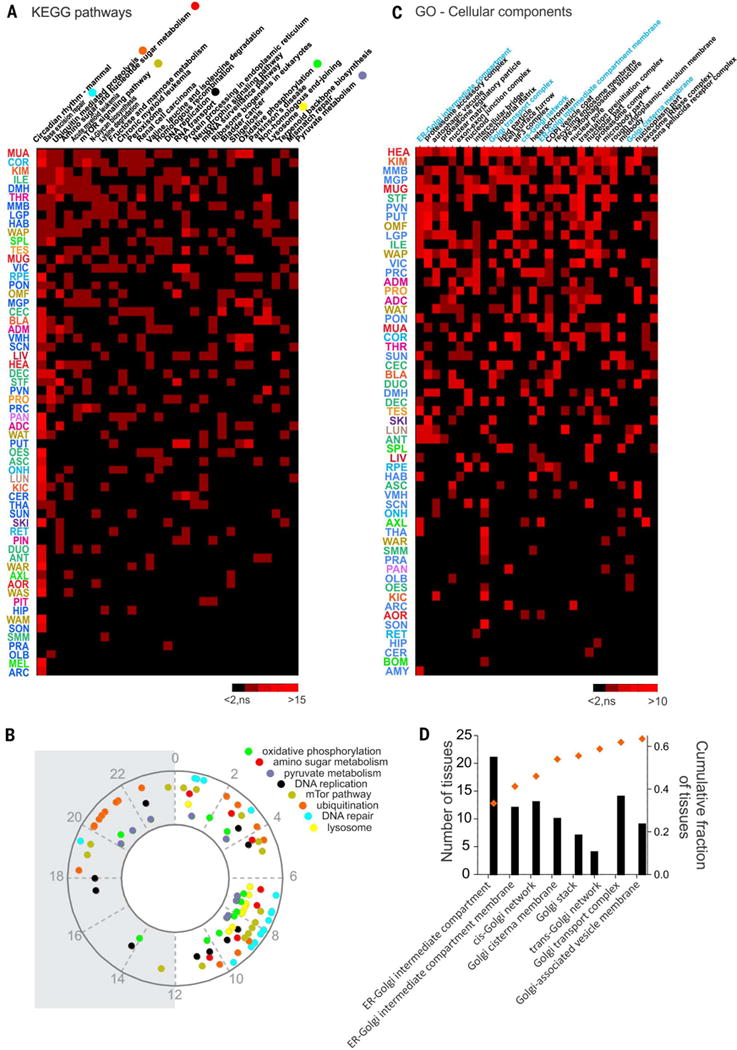
Fig. 6. Rhythmic transcription drives coordinated cellular organization and rhythmic physiology.

(A) Heatmap of the KEGG pathways enriched for cycling genes in more than 10 tissues. Pathways satisfying the criteria of overrepresentation analysis (ORA) (gene number > 2, z score > 2, and permuted P < 0.05) are shown in red (red intensity codes for the z score). Insignificantly enriched pathways are represented in black. (B) Phase distribution over the 24-hour cycle of representative KEGG pathways. Phases were calculated and statistically tested with the PSEA tool. (C) Heat-map of the GO cell components terms enriched for cycling genes in more than 10 tissues. Red indicates the pathways satisfying the criteria of overrepresentation analysis as described for (A). (D) Histogram of the number of tissues showing overrepresentation for Golgi-related GO-cellular component terms sorted from the cis to the trans side of the Golgi apparatus. Superimposed is the cumulative fraction of the rhythmic regulation for each GO term in the 45 tissues (out of 64) in which at least one of these GO terms that are related to the Golgi apparatus was cycling.
