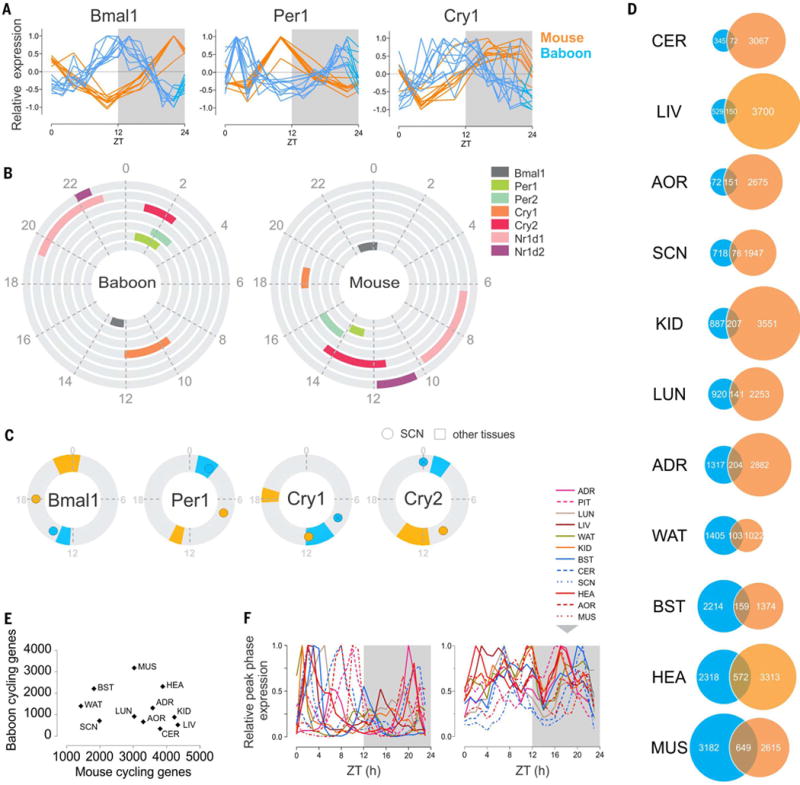
Fig. 7. Comparison of rhythmic transcriptome organization in the diurnal primate and nocturnal rodent.

(A) Normalized daily expression profiles of Bmal1, Per1, and Cry1 across 10 tissues in mouse and baboon (ADR, AOR, BST, CER, HEA, KID, LIV, LUN, MUS, and WAT). (B) Phase distribution of the main clock genes in the baboon (left) and the mouse (right). The colored fraction of the rings corresponds to the confidence interval (95%) of the phases of the corresponding clock genes in the tissues in which these genes were detected as cycling. (C) Comparison of the phase of Bmal1, Per1, Cry1, and Cry2 in the SCN (dot) and in the other the tissues (95% confidence interval) in mouse (orange) and baboon (blue). Baboon Cry1 and Cry2 are not detected as cycling in the SCN; their maximum expression is represented (crossed circle). (D) Numbers of cycling genes in selected tissues compared in the baboon and the mouse and overlap of common cycling genes in the two species. (E) A tissue-by-tissue comparison showing the lack of correlation of the number of cycling genes in the baboon and in the mouse (R2 = 0.086, P = 0.38). (F) Normalized peak phases of gene expression in 12 tissues throughout the day (left in the baboon, right in the mouse).
