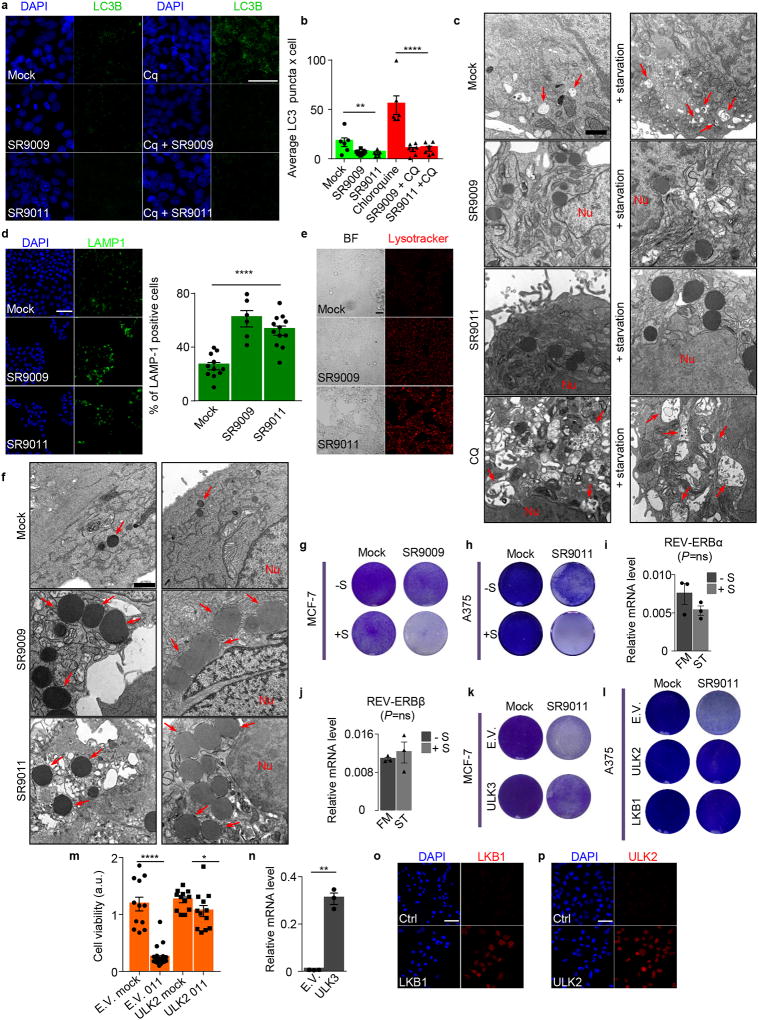
Extended Data Figure 6. REV-ERB agonists SR9009 and SR9011 block autophagy.
a, REV-ERBs agonists blockage of autophagy results in a reduced autophagic flux; b, Quantification of LC3 puncta; n=biological independent samples n=6 (mock, CQ ± SR9011), n=11 (SR9009) n=5 (SR9011), n=7 (CQ+ SR9009) one-way ANOVA mock vs SR9009/011 **P=0.0049; one-way ANOVA CQ vs CQ+SR9009/011 ****P<0.0001. c, Upon SR9009 and SR9011 treatment autophagy blockage is also observed by electron microscopy and even under starvation. Arrows indicate representative autophagosomes. Nu= nucleus. Scale bars 1uM (n=3 biologically independent samples of two independent experiments with similar results (mock ± SR9009 and SR9011) one experiment (mock, SR9009 and SR9011 ± starvation). d, REV-ERB agonists induce lysosomes accumulation as showed by immunofluorescence assay for lysosome marker LAMP1 (n= biological independent samples, n=11 mock, n=6 SR9009, n= SR9011 T47D, 72h 20µM, one-way ANOVA ****P<0.0001. e, Lysosomes accumulation is also confirmed by lysotracker (MCF-7, 72h 20µM; Scale bars 50 µm. f, Drastic lysosomal turnover defects are also evident on electron microscopy (n=3 biologically independent samples of two independent experiments with similar results). Arrows indicate lysosomes. CQ= chloroquine; Nu= nucleus. Scale bars 1uM. g–h, Starvation synergizes with REV-ERBs agonist SR9009 treatment (MCF-7 48h, 20µM; A375, 3 days 20µM). i–j, Starvation has no effect on REV-ERBs expression as shown by qRT-PCR; Mann–Whitney test two-tailed P=ns; k–l, Overexpression of ULK3, ULK2 and LKB1 impairs SR9011 induction of apoptosis (MCF-7, A375 6 days 20µM); m, WST-1 viability assay shows abrogation of apoptosis in ULK2 overexpressing cells; n= biological replicates, n=12 (E.V. mock, ULK2 mock, ULK2 SR9011), n= 27 (E.V. SR9011) A375, 6 days 20µM; Mann–Whitney test one-tailed E.V. Mock vs E.V. 011 ****P< 0.0001; ULK2 Mock vs ULK2 011 *P=0.0225). n. qRT-PCR shows overexpression of ULK3 (Student's t-test one-tailed **P=0.0031); o–p, immunofluorescence assay confirms overexpression of LKB1 and ULK2. i–j,n n=3 biological independent samples. Scale bars 50 µm. E.V.= empty vector; CQ= chloroquine. BF= bright field. Ns= not significant. All panels three biological independent experiments with similar results, except otherwise specified. All the data are plotted as mean ± s.e.m.

