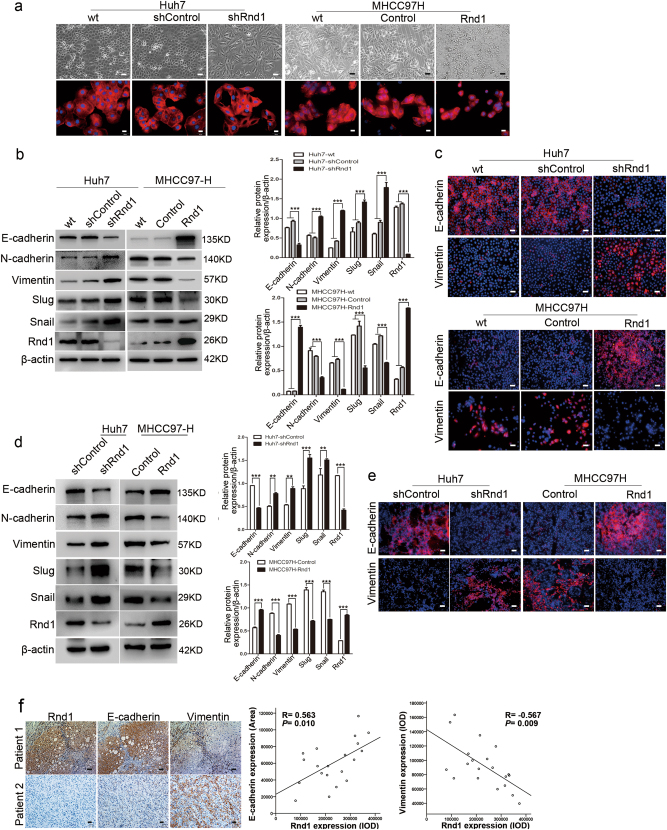
Fig. 3. Low expression of Rnd1 induces EMT in HCC cells.
a (upper) Representative phase-contrast images of Huh7-shRnd1 cells, MHCC97H-Rnd1 cells, and their respective wild type and control cells. a (lower) Representative IF images of cytoskeleton in Huh7-shRnd1 cells, MHCC97H-Rnd1 cells, and their respective wild type and control cells. Scale bar: 50 μm (upper), 20 μm (lower). b Western blot analysis of E-cadherin, N-cadherin, vimentin, Slug, and Snail protein expression in HCC cells with knockdown or overexpression of Rnd1 and their corresponding wild type and control cells. Densitometry of western blot in panel. Data are mean ± S.D. (n = 3) and are representative of three independent experiments. Significance was determined using two-way ANOVA. ***P < 0.001. c IF staining for E-cadherin and vimentin in Huh7, Huh7-shControl, Huh7-shRnd1, MHCC97H, MHCC97H-Control, and MHCC97H-Rnd1 cells. 4′,6-diamidino-2-phenylindole (DAPI) was used to stain nuclei. Scale bar: 50 μm. d Western blot analysis of E-cadherin, N-cadherin, vimentin, slug, snail, and Rnd1 expression in HCC tissues derived from orthotopic xenograft tumor models. Densitometry of western blot in panel. Data represent means ± S.D. (n = 3) of three independent experiments. Significance was determined using two-way ANOVA. *P < 0.05, **P < 0.01, ***P < 0.001. e Representative IF images of E-cadherin and vimentin from Huh7-shControl, Huh7-shRnd1, MHCC97H-Control, and MHCC97H-Rnd1 tumors in nude mice. Scale bar: 50 μm. f A positive association between Rnd1 and E-cadherin, however, a negative association between Rnd1 and vimentin is observed in serial slices of hepatoma tissue (n = 20; R = 0.563, P = 0.010 and R = −0.567, P = 0.009, respectively). Scale bar: 100 μm (upper), 20 μm (lower)

