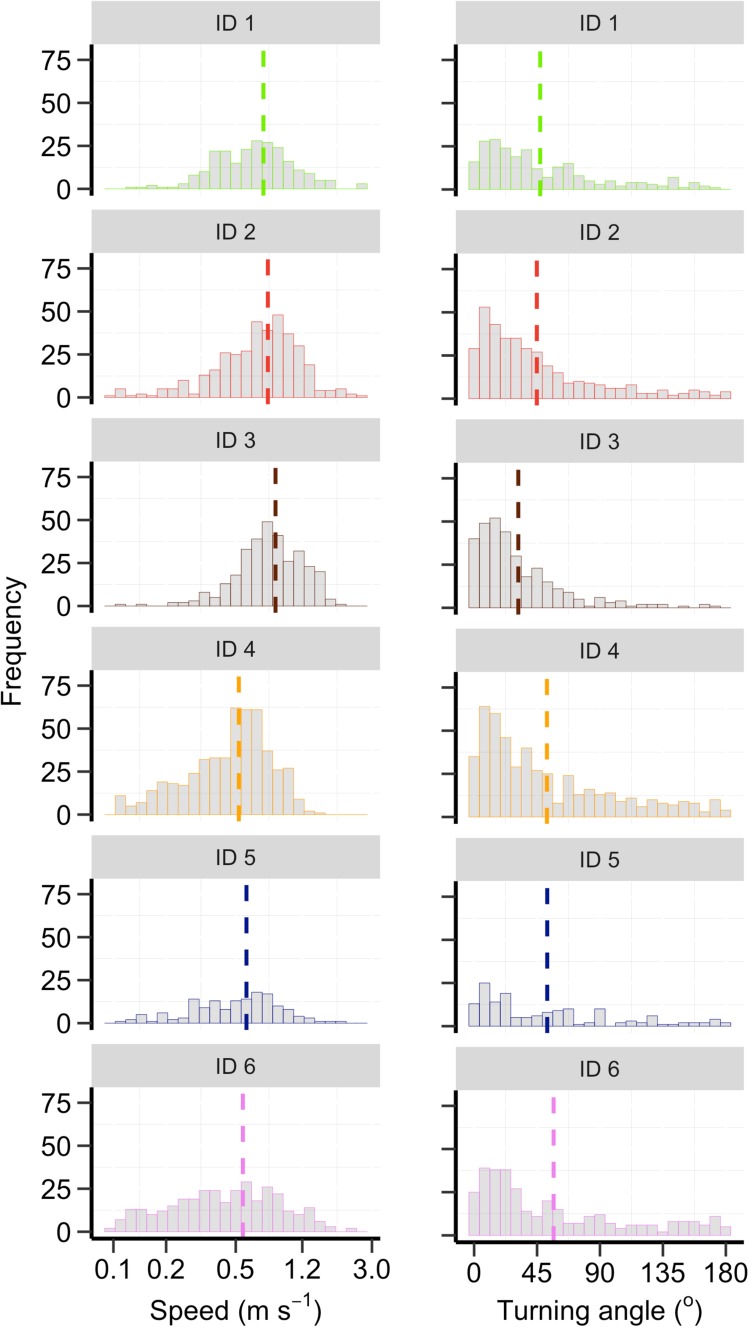
Fig. 3.
Individual-specific frequency distributions for horizontal movement speed (m s−1) and turning angles (°) between successive GPS locations taken at 15-min intervals. Colours of the bars indicate the six different harbour porpoise individuals and the vertical dashed lines indicate individual-specific means of the movement parameter

