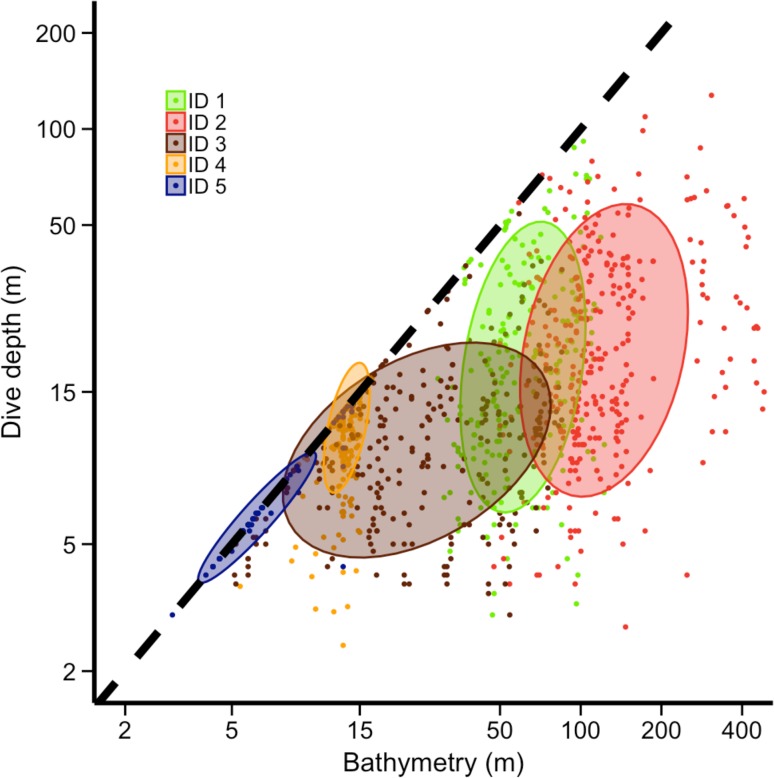
Fig. 6.
Plot of bathymetry versus individual-specific dive depth. Coloured dots close to the dashed black line indicate dives down to the seabed and coloured eclipses surround 65% of the dives taken around the mean dive depth of each porpoise. Note that ID 6 could not be shown due to missing dive data

