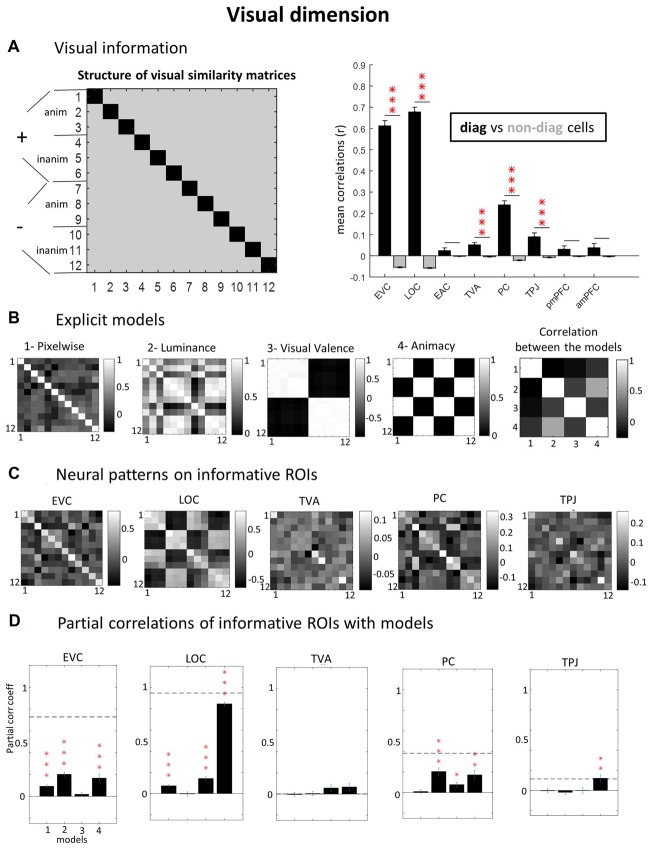
Figure 3.
Visual dimension. (A) ROIs with visual information (diagonal vs. non-diagonal). Using a “visual GLM” where only the 12 visual conditions are declared and applying correlation-based Multivoxel Pattern Analysis (MVPA), we calculated neural similarity matrices for each subject and ROI (left panel). To verify which ROI contain visual information, we contrasted pair of trials with the same visual image (diagonal cells, in black) against pairs of trials with different images (non-diagonal cells, in gray). If particular visual information would be present in the ROI, the correlations in the diagonal cells would be significantly higher than in non-diagonal cells. (B) Explicit models. To investigate the kind of visual representation present in each informative ROI we built explicit models in relation to specific stimulus parameters: pixel-by-pixel values, mean luminance, group average visual valence ratings and animacy (animate vs. inanimate images). We also calculated the correlation among the models (extreme right). (C) Neural patterns on informative ROIs. Group average neural similarity matrices for each ROI are plotted. (D) Partial correlations of informative ROIs with models. To test the best predictive models of neural patterns, we performed partial correlations of neural and model matrices (using only non-diagonal cells, averaged across upper and lower triangles). Horizontal dashed lines represent Signal-to-Noise Ratio (SNR) estimations (see “Materials and Methods” section). Note that the SNR for TVA is close to zero (5.6e-04) and cannot be visualized. P-values of paired t-tests across subjects were Bonferroni-corrected, considering the number of ROIs, leading to the following thresholds: *p < 0.0063; **p < 0.0013; ***p < 1.25e-04. Error bars = ± SEM.

