Figure 2.
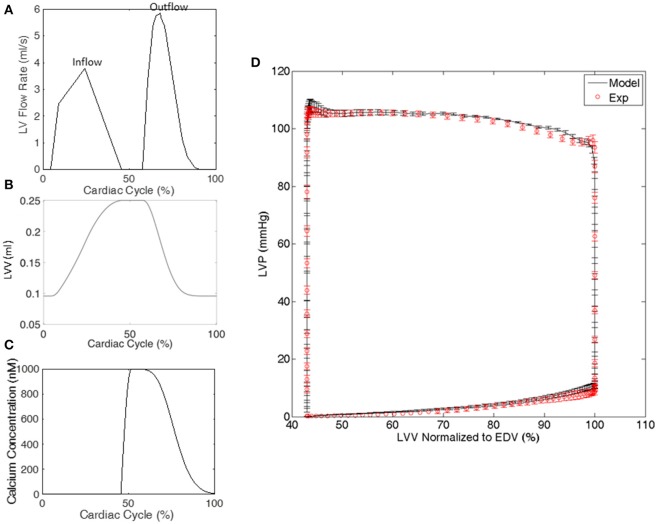
Representative examples from a single rat of (A) the volumetric flowrate into and out of the LV used to drive the cardiac cycle in the FE model, (B) the LV volume (LVV) generated by the FE model, and (C) the calcium transient in the LV model. (D) The LV pressure-volume relationship generated by all of the FE models and experiments. LV pressure (LVP) data are mean ± standard error (SE); n = 5. LVV data shown in (D) were normalized to end diastolic volume (EDV).

