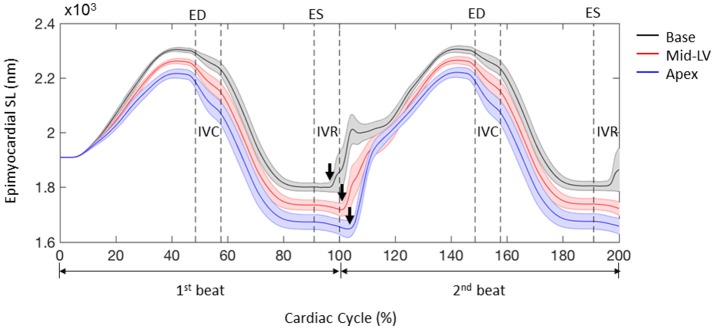
Figure 7.
Profiles of sarcomere length (SL) over 2 cardiac cycles obtained from 3 representative elements located at the base, mid-LV, and apex in the lateral epicardium. Data are mean (thick solid lines) ± SE (shaded area); n = 5. Note that the simulations start from the unloaded state. Arrows indicate the beginning of re-lengthening.

