Figure 9.

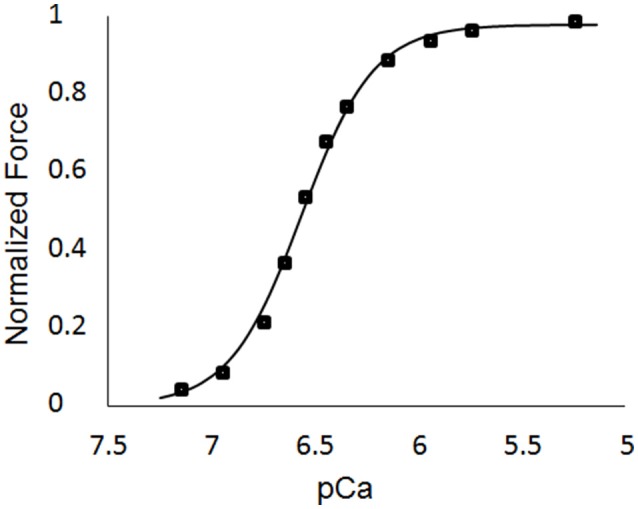
Force-pCa curve for Case 1. The square markers represent the values from the single element simulations, while the curve fit is the Hill equation with a value of pCa50 = 6.53 and a Hill coefficient = 2.51.

Force-pCa curve for Case 1. The square markers represent the values from the single element simulations, while the curve fit is the Hill equation with a value of pCa50 = 6.53 and a Hill coefficient = 2.51.