
Figure 9.
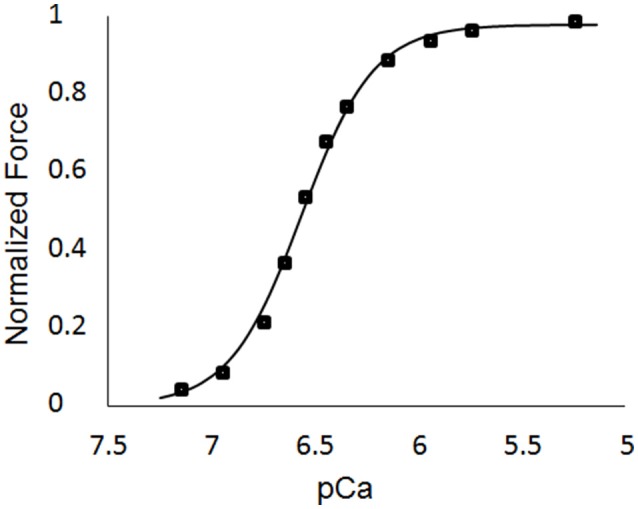
Force-pCa curve for Case 1. The square markers represent the values from the single element simulations, while the curve fit is the Hill equation with a value of pCa50 = 6.53 and a Hill coefficient = 2.51.
Official websites use .gov
A
.gov website belongs to an official
government organization in the United States.
Secure .gov websites use HTTPS
A lock (
) or https:// means you've safely
connected to the .gov website. Share sensitive
information only on official, secure websites.
Force-pCa curve for Case 1. The square markers represent the values from the single element simulations, while the curve fit is the Hill equation with a value of pCa50 = 6.53 and a Hill coefficient = 2.51.