Table 1.
Total antioxidant capacity and ChEs inhibitory activity (IC50) data of compounds AntiOxBEN1, AntiOxBEN2, 15–18 and donepezil.
| Compound | Structure | IC50 (μM ± SD) | IC50 (nM ± SD) | SI | Ep (mV) | ||
|---|---|---|---|---|---|---|---|
| DPPH• | ABTS•+ | AChE | BChE | ||||
| AntiOxBEN1 | 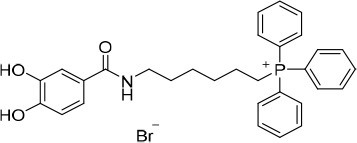 |
31.0 ± 0.8* | 20.7 ± 0.8* | >50 | 85 ± 5 | > 588 | 219* |
| AntiOxBEN2 | 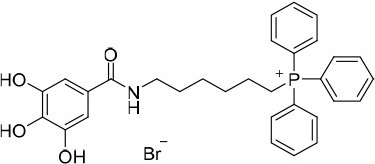 |
14.0 ± 0.3* | 6.5 ± 0.5* | 40.5 ± 7.0 | 474 ± 17 | 86 | 115* |
| 15 | 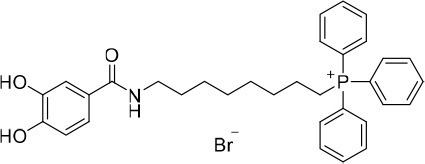 |
31.2 ± 0.9 | 23.5 ± 1.3 | 11.2 ± 0.8 | 106 ± 5 | 106 | 216 |
| 16 | 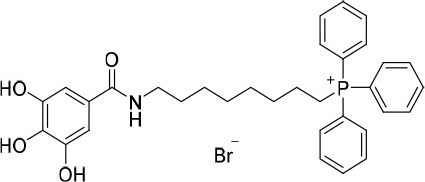 |
16.8 ± 1.6 | 6.8 ± 0.6 | 15.7 ± 0.9 | 255 ± 9 | 62 | 121 |
| 17 | 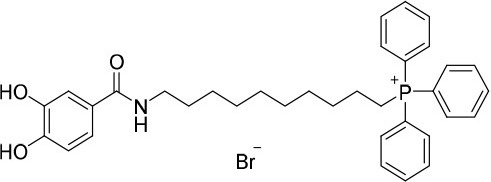 |
31.0 ± 0.6 | 19.4 ± 1.0 | 7.7 ± 0.4 | 195 ± 20 | 41 | 210 |
| 18 | 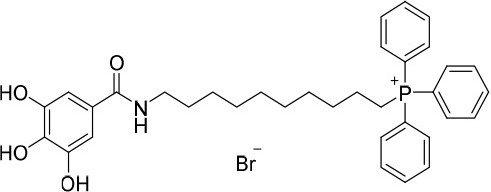 |
10.2 ± 1.1 | 7.4 ± 0.5 | 7.2 ± 0.5 | 553 ± 22 | 13 | 114 |
| Donepezil | 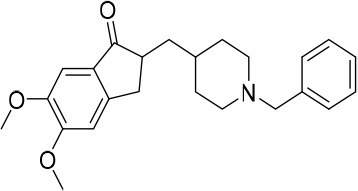 |
n.d. | n.d. | 0.025 ± 0.001 | 2200 ± 200 | 0.011 | n.d. |
n.d.: not determined.
Data from Teixeira et al. (2017a).
SI: BChE selectivity index = IC50(AChE)/IC50(BChE).
