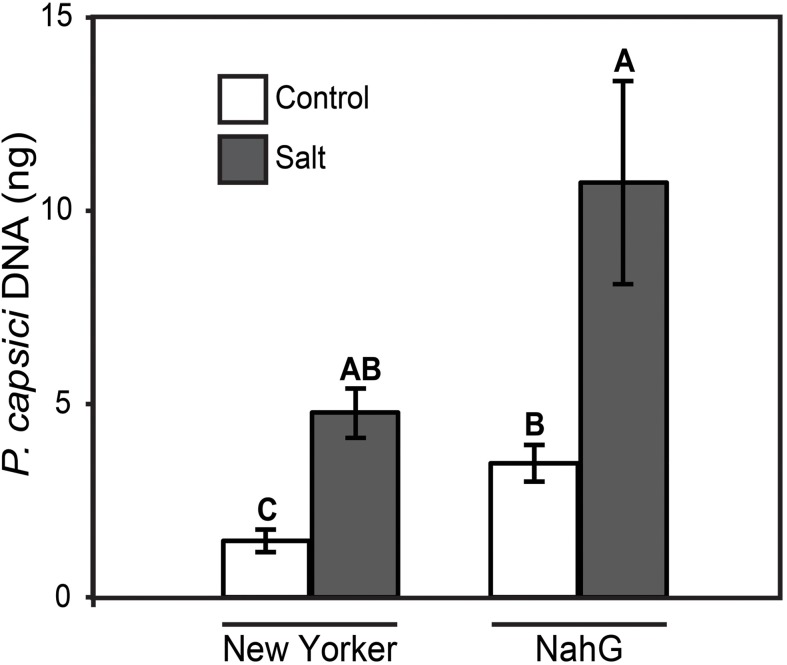
FIGURE 6.
P. capsici colonization 48 hpi on ‘New Yorker’ (WT) and NahG (in “New Yorker’ background) tomato seedlings non-stressed (control) or salt stressed with 0.2 M NaCl/0.02 M CaCl2 for 18 h. Colonization estimated by qPCR of pathogen DNA. Letters indicate significant differences at P = 0.05 (T-test). Values are the means ± SE from three experiments, with five samples, each from a separate seedling, for each treatment within each experiment (n = 15).

