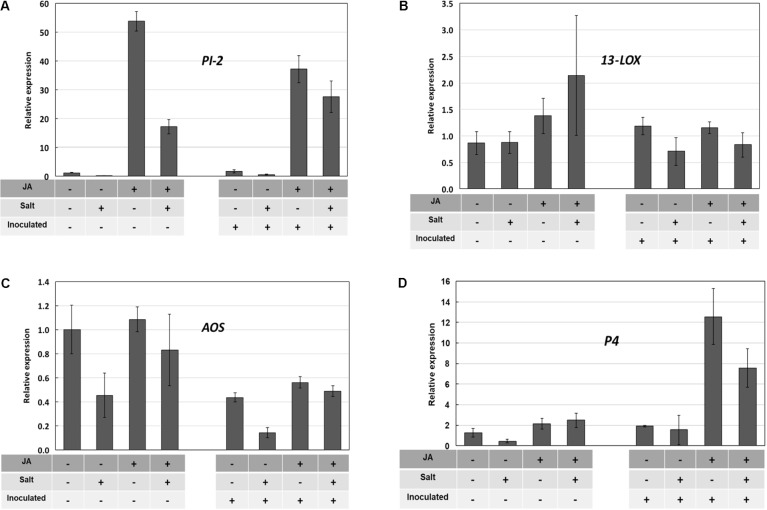
FIGURE 7.
Pathogenesis-related (PR) and JA-synthesis gene expression in ‘New Yorker’ tomato roots in response to JA, salt stress, and inoculation with P. capsici. Treatment combinations are indicated by “+” and “–” below each bar. Bars indicate relative gene expression determined by RT-qPCR (means and SE from three determinations are indicated; selected means were compared by Wilcoxon rank sums test). The treatment sequence was: JA or water (72 h) recovery (48 h) salt or no salt (18 h) recovery (2 h) inoculated or non-inoculated (24 h) collect roots for RT-qPCR. See Section “Materials and Methods” for additional detail. (A) PI-2 expression; JA strongly induced PI-2 expression (χ2 = 15.6, P < 0.0001), salt suppressed the JA induction (χ2 = 3.15, P = 0.076) (B) 13-LOX expression; (C) 13-AOS expression; salt reduces AOS expression (χ2 = 4.03, P = 0.045) (D) P4 expression; JA potentiates P4 expression in inoculated roots (χ2 = 3.00, P = 0.083).

