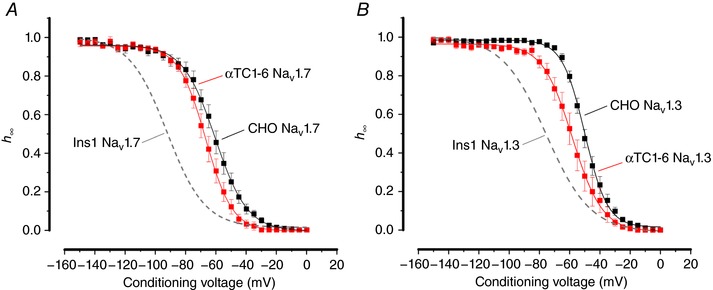
Figure 5. Voltage dependence of inactivation of NaV1.7 and NaV1.3 currents in αTC1‐6 and CHO cells.

A, voltage dependence of inactivation of NaV1.7 currents when the α‐subunit is coexpressed with β1‐ and β2‐subunits in αTC1‐6 (red; n = 10) and CHO (black; n = 10) cells. The curve represents a single Boltzmann fit to the data and the grey dashed line represents the inactivation of NaV1.7 expressed in Ins1 cells (shown in Fig. 3). B, same as in A, but experiments were conducted with NaV1.3 in αTC16 (red; n = 9) and CHO cells (black; n = 13). See also Table 1. [Color figure can be viewed at http://wileyonlinelibrary.com]
