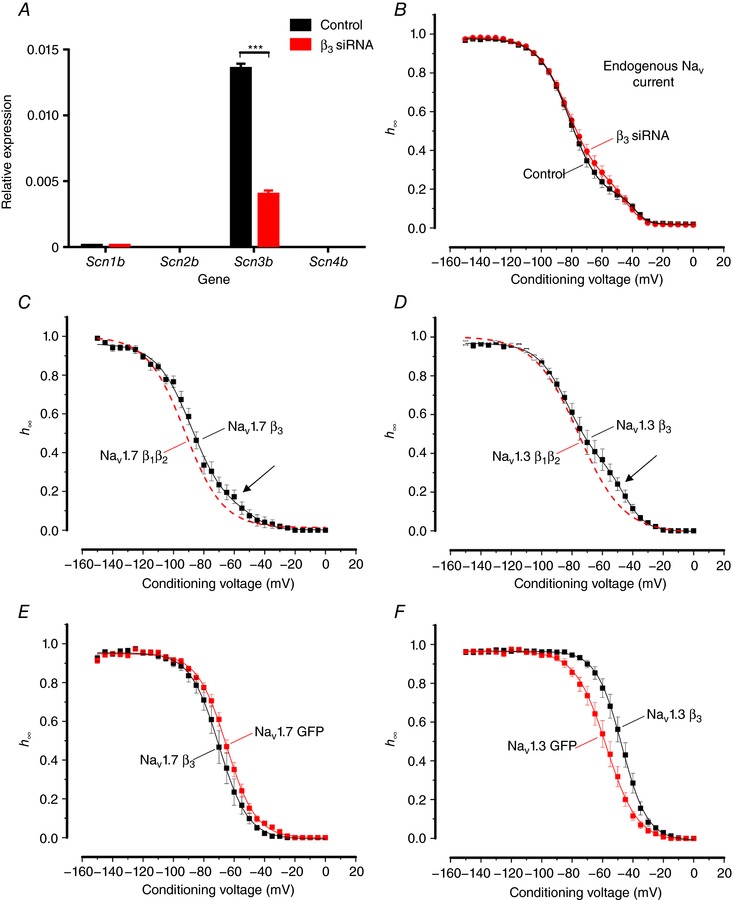
Figure 6. Effect of β‐subunits on NaV current inactivation in Ins1 and HEK cells.

A, relative mRNA expression of Scn1b, Scn2b, Scn3b and Scn4b in control Ins1 cells transfected with a scramble siRNA or β3 siRNA (n = 3 preparations). B, voltage dependence of inactivation (h ∞) of endogenous NaV currents from control (black; n = 22, from 3 preparations) and β3 siRNA treated Ins1 cells (red; n = 26 from 3 preparations). The curves represent a double Boltzmann fit to the data. C, voltage dependence of NaV1.7 current inactivation when the α‐subunit is co‐expressed with β3‐subunit (black; n = 9) in Ins1 cells. Dashed red curve represents voltage dependence of NaV1.7 current inactivation when the α‐subunit is co‐expressed with β1‐ and β2‐subunits in Ins1 cells (data shown in Fig. 3). The curves represent a double Boltzmann fit to the data. Arrow indicates a component of inactivation occurring at positive membrane potentials. D, as in C but for NaV1.3 (black; n = 11). E, voltage dependence of NaV1.7 current inactivation when the αsubunit is coexpressed with β3‐subunit (black; n = 9) or GFP alone (red; n = 12) in HEK cells. The curves represent a single Boltzmann fit to the data. F, as in E, but for NaV1.3 (black, n = 12; red; n = 10). V h and k value for the respective conditions are given in Table 2. [Color figure can be viewed at http://wileyonlinelibrary.com]
