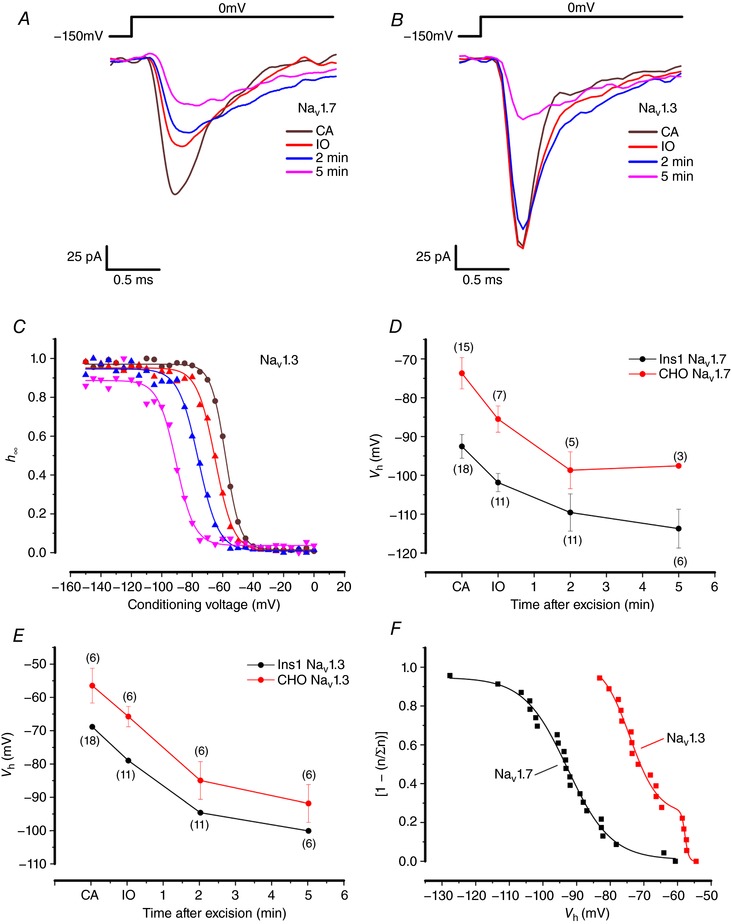
Figure 7. Current inactivation of NaV1.7 and NaV1.3 in cell‐attached and inside‐out configuration.

A, NaV1.7 currents when the α‐subunit is co‐expressed with β1 and β2 in Ins1 cells in response to a step depolarization from −150 to 0 mV in cell‐attached (CA), inside‐out (IO) and 2 and 5 min after excision. B, same as in A, but with NaV1.3 currents in Ins1 cells. C, voltage dependence of inactivation of NaV1.3 currents shown in B (same colour code). D, summarized voltage dependence of inactivation of NaV1.7 currents in Ins1 (black) and CHO cells (red) of indicated number of patches/cells (n). E, same as in D but for NaV1.3. F, cumulative distribution of NaV1.3 (red) and NaV1.7 (black) V h recorded in cell‐attached patches on Ins1 cells. Data have been normalized (n/∑n) to the total number of patches (n = 18 patches for NaV1.3 and n = 23 patches for NaV1.7). For display and to facilitate comparison with inactivation curves, data are shown as (1 − [n/∑n]). The cumulative distributions have been fitted to a double Boltzmann function for NaV1.3 and a single Boltzmann function for NaV1.7. [Color figure can be viewed at http://wileyonlinelibrary.com]
