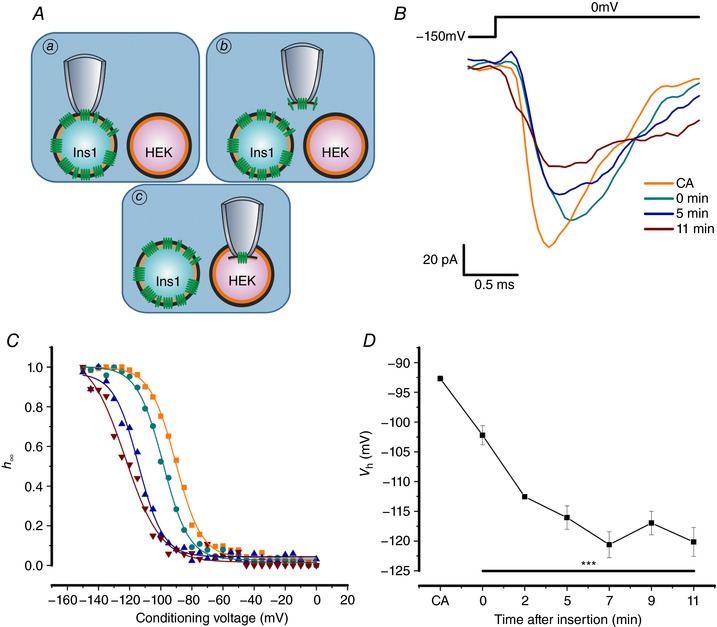
Figure 8. NaV1.7 expressed in Ins1 cells crammed into HEK cells.

A, schematic representation of patch cramming procedure. NaV1.7 channels were expressed in Ins1 cells and a cell‐attached patch was formed (a); the patch of membrane was excised (b) and immediately crammed into HEK cells (c). B, NaV1.7 currents when the α‐subunit is co‐expressed with β1‐ and β2subunits in response to a step depolarization from −150 to 0 mV in cell‐attached (CA) configuration in Ins1 cells, immediately after excision and cramming into HEK cells (0 min) and 5 and 11 min after insertion of the membrane into HEK cells. C, voltage dependence of inactivation of NaV1.7 currents shown in B with same colour coding. D, summarized voltage dependence of inactivation of NaV1.7 currents in cell‐attached configuration and after cramming into HEK cells (n = 4). *** P < 0.001 for each time point compared to CA, using a one‐way ANOVA. [Color figure can be viewed at http://wileyonlinelibrary.com]
