
Figure 10. Characterization of endogenous NaV currents in Ins1 and αTC1‐6 cells.
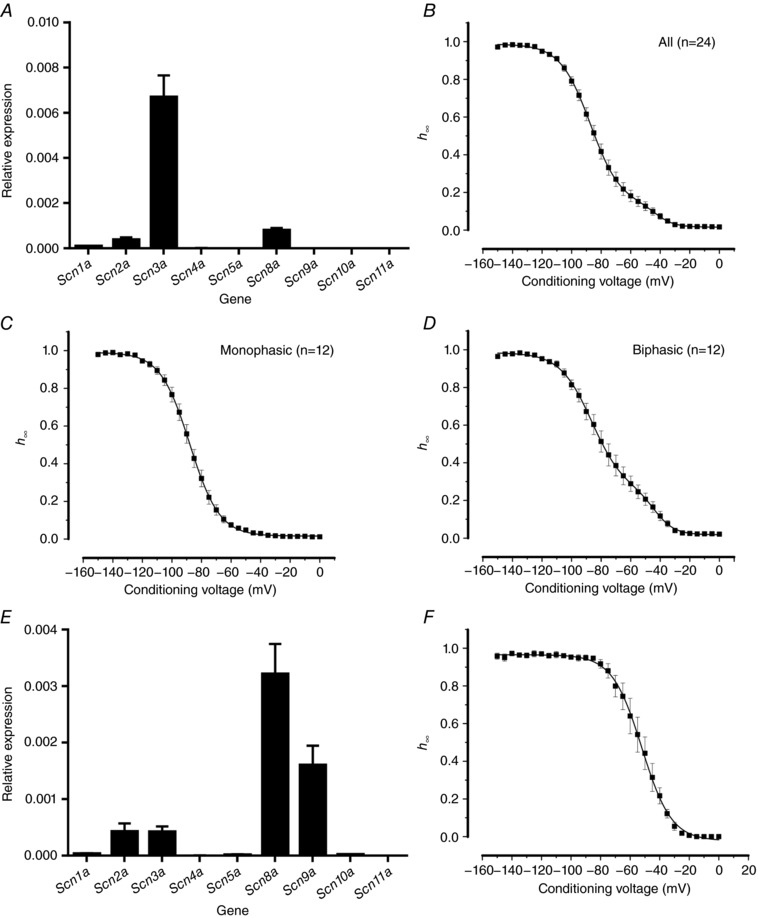
A, relative mRNA expression of NaV channel α‐subunits in Ins1 cells (n = 2 preparations). B, voltage dependence of inactivation of endogenous Ins1 NaV currents, average of all cells (n = 24). Curve represents a double Boltzmann fit to the data. C, as in B but for cells with NaV inactivation best fitted to a single Boltzmann function (i.e. had a monophasic inactivation; n = 12). D, as in C but for cells where inactivation was best fitted to a double Boltzmann function (i.e. had a biphasic inactivation; n = 12). E, relative mRNA expression of NaV channel α‐subunits in αTC1‐6 cells (n = 3 preparations). F, voltage dependence of inactivation of endogenous αTC1‐6 NaV currents (n = 6).