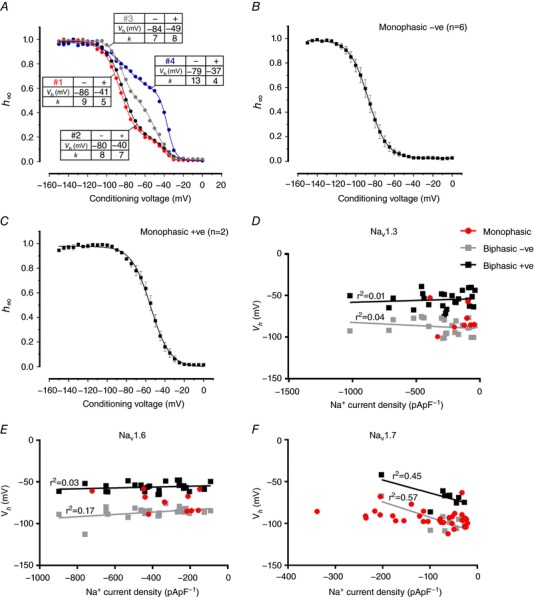
Figure 11. Biphasic inactivation of NaV1.3, 1.6 and 1.7 currents in Ins1 cells.

A, examples of biphasic inactivation of NaV1.3 currents when the αsubunit is coexpressed with β1 and β2 subunits in four different Ins1 cells (nos 1–4). The tables next to the curves show V h and k values for the components inactivating at negative (−) and more positive (+) membrane potentials. The curves represent a double Boltzmann fit to the data. B, average voltage dependence of inactivation of NaV1.3 currents in Ins1 that were best described with a single Boltzmann fit to the data and had a V h <−70 mV (n = 6). C, average voltage dependence of inactivation of NaV1.3 current in Ins1 cells that were best described with a single Boltzmann fit to the data that had a V h >−70 mV (n = 2). D, relationship between monophasic, biphasic negative (−ve) and biphasic positive (+ve) V h values and the peak Na+ current density of NaV1.3 in Ins1 cells. The lines represent linear regression fits to the data. The r 2 values are given next to the respective fit. E and F, same as in D but for NaV1.6 (E) and NaV1.7 (F). [Color figure can be viewed at http://wileyonlinelibrary.com]
