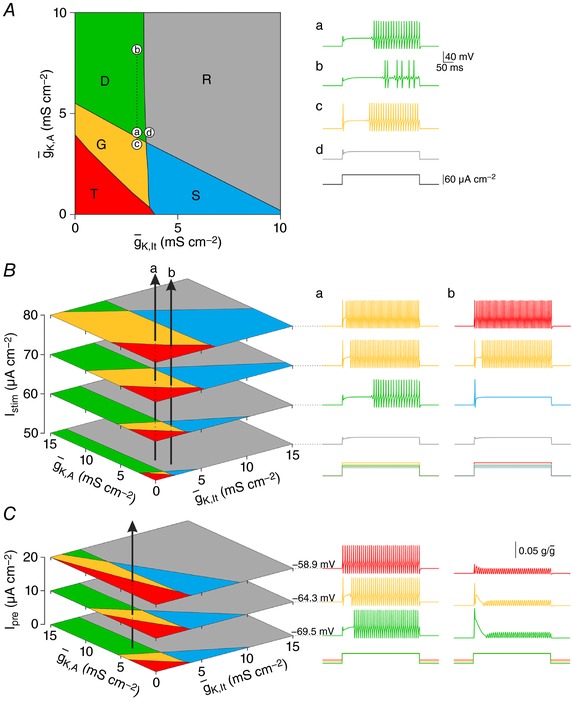
Figure 3. Relationship between ion channel densities and spiking pattern.

A, systematically co‐varying and revealed that distinct regions in this 2‐D parameter space yield different spiking patterns. Boundaries shown here are based on testing with I stim = 60 μA cm−2. Traces in a–d show sample responses for parameter values labelled on the main plot. Large parameter variations that remain within a region yield the same spiking pattern; compare condition a ( = 3 mS cm−2, = 4 mS cm−2) with condition b ( increased by 4 mS cm−2). In contrast, small parameter variations that cross a boundary yield different spiking patterns; compare condition a with condition c ( reduced by 0.5 mS cm−2) or condition d ( increased by 0.5 mS cm−2). B, boundaries can shift because of stimulus intensity (I stim), meaning a neuron with fixed values of and K,A can exhibit different spiking patterns at different I stim. To illustrate, each vertical arrow on the left panel represents a neuron: for neuron a, = 3 mS cm−2 and = 4 mS cm−2; for neuron b, = 3.5 mS cm−2 and = 2.5 mS cm−2. The spiking pattern at each I stim (illustrated on the right) depends on which region the arrow passes through. C, boundaries can also shift because of pre‐stimulus membrane potential. For these simulations, a subthreshold ‘pre‐pulse’ (I pre) was used to vary the membrane potential before the onset of suprathreshold stimulation. Each plane represents the response to I stim = 60 μA cm−2 after a different pre‐pulse (pre‐stimulus membrane potential is indicated beside each voltage trace). The vertical arrow represents a neuron with = 2 mS cm−2 and = 6 mS cm−2. Traces on the right show the reduced availability of g K,A depending on I pre. By partially inactivating g K,A, subthreshold depolarization reduces the availability of those channels for activation during suprathreshold stimulation, effectively re‐scaling the y‐axis.
