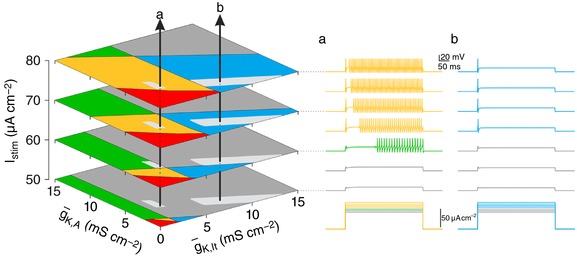
Figure 4. Estimating ion channel densities from spiking pattern sequences.

Spiking patterns were determined for I stim between 50 and 80 μA cm−2, at 5 μA cm−2 increments for two neurons labelled a and b on left. Planes are shown for only a subset of I stim. To estimate the channel densities in neurons a and b, we determined all combinations of K,A and K,lt that could produce that sequence. The grey patches shown on each plane together demarcate the volume in which each arrow must exist. The spiking pattern sequence for neuron a leads to a more tightly constrained estimate of ion channel densities than does the sequence for neuron b.
