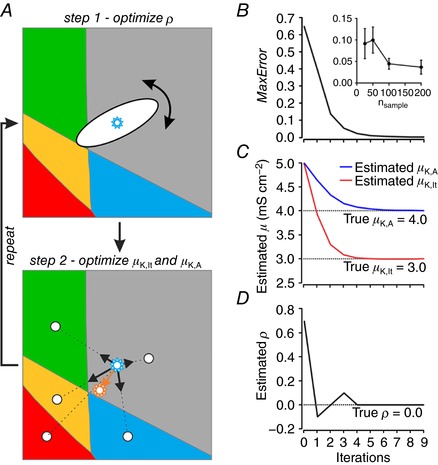
Figure 6. Estimating ion channel density distributions from spiking pattern proportions.

A, schematic representation of the iterative, two‐step process used to estimate the joint distribution of ion channel densities (μK,lt, μ,K,A and ρ) from an observed (target) set of spiking pattern proportions. Starting with arbitrarily chosen parameter values for μ, in step 1, ρ is systematically varied in 0.1 increments to find the value yielding the best match between estimated and target spiking pattern proportions. That value is carried forward to step 2, in which estimates of μK,lt and μ,K,A are updated by drawing vectors from the centre of the joint distribution to the centroid of each spiking pattern region. The length of each vector was adjusted based on the error (see Methods) and the distribution is shifted to the position given by the net vector. Step 1 was then repeated with the updated values of μK,lt and μ,K,A, and so on, until the error decreased below a threshold, after which point ρ was systematically varied in 0.01 increments for greater accuracy. The algorithm continued until the MaxError reached a minimum (B) and estimates of μ (C) and ρ (D) stabilized, which occurred within a few iterations. Data in B–D show results of fitting the spiking pattern proportions from a target distribution with μK,lt = 3 mS cm−2, μ,K,A = 4 mS cm−2, ρ = 0 and σK,lt = σK,A = 1 mS cm−2. In additional tests, n samples were drawn randomly from the target distribution and spiking pattern proportions were determined from the fraction of samples falling within each spiking pattern region. Regardless of how target spiking pattern proportions were generated, the estimation process was the same. Inset in panel B shows MaxError at steady‐state (mean ± standard deviation) as a function of n sample, where each data point is based on five tests.
