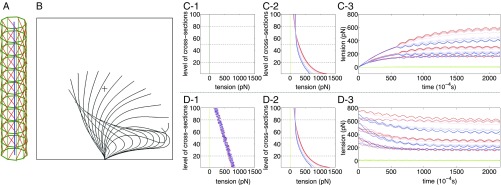
Fig. 1.
(A) Structure of the model cilium showing centerline (blue), peripheral doublet microtubules (green), and dynein links (red). (B) The beating cycle of a single model cilium in fluid. (C and D) Tensions in the passive 5-6 bridges (green) and dynein links (red on one side of the cilium and blue on the other side). C1 and D1 show initial tensions, which are zero in C1 and randomly chosen in D1. C2 and D2 show tensions at a selected time after the limit cycle has been reached. C3 and D3 show the development of tension over time in selected levels (20, 50, and 80 of 100 levels) of the model. In C3, the initial tensions are all zero, and the tensions remain the same as each other within any one level until about s, at which time the symmetry breaks and the ciliary beat begins. In D3, the initial tensions are random, and the beat begins immediately. Despite this transient difference, the eventual beat patterns are the same in the two cases (Movies S1 and S2).

