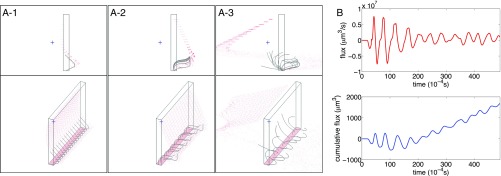
Fig. 2.
Symmetry breaking in a diaplectic row of cilia. (A) Configuration of cilia (black curved lines) at selected times from two points of view. Red dots are fluid markers, some of which mark the floor (which is also a ceiling of the periodic domain). Rectangular box shows one unit cell of the periodic computation. The cilia (black curved lines) are initially synchronized (A1). The symmetry starts to break in A2, and by the time shown in A3, the cilia have adopted multiple phases (Movie S3). (B) Flux of fluid (positive to the left) generated by the beating cilia. Upper (red curve) shows instantaneous flux, and Lower (black curve) shows cumulative flux. The upward trend in the cumulative flux begins only after the symmetry has broken and the cilia have adopted multiple phases.

