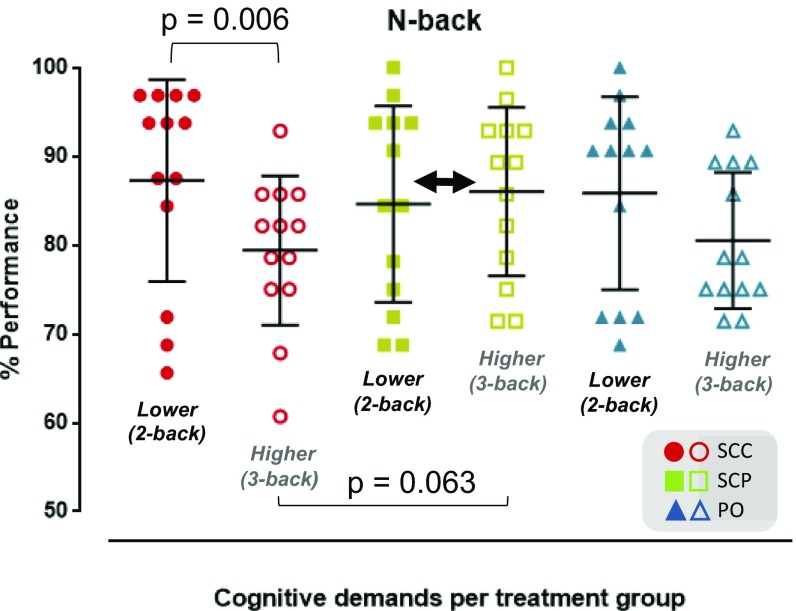
Fig. 3.
Cognitive performance. The marginal mean estimates of %accuracy indicate the three treatment groups’ performance in the working memory task (n-back), and how they change when going from the two-back test (87.3 ± 11.4 for the SCC group, 84.6 ± 11.1 for the SCP group, and 85.8 ± 10.9 for the PO group) to the more challenging three-back test (79.4 ± 8.4 for the SCC group, 86 ± 9.5 for the SCP group, and 80.5 ± 7.7 for the PO group). The working memory performance in the SCC group drops notably when the cognitive demands increase (P < 0.01). In contrast to the other two treatment modes, the SCP group retains its working memory capacity when the cognitive demands increase (double-headed black arrow), especially compared with the SCC group (P = 0.063).

