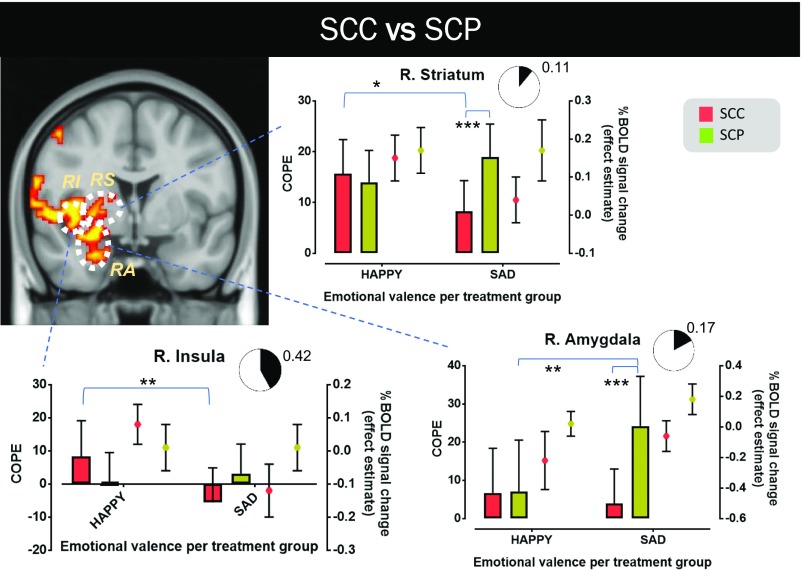
Fig. 5.
Neural processing differences in emotional discrimination in GC-sensitive brain regions between the SCC and SCP groups. The coronal view of MNI152 standard space (spatial resolution of 0.5 mm) shows these brain regions in yellow-red, in which BOLD signal changes in response to happy and sad faces differ notably between the two treatment groups. Three ROIs are identified in this view (RA, RI, and RS). For each ROI, the mean value of the corresponding contrast of parameter estimate (COPE; happy vs. baseline and sad vs. baseline) and its mean across-subject effect estimate (%BOLD signal change vs. baseline) are presented. A measure of the effect size of each mode of cortisol dynamics on the differential processing between happy and sad faces is also shown (pie charts depicting the extent of the involvement of the corresponding brain region in the differential processing). In the SCP group, the right amygdala (“R. Amygdala” graph) is activated significantly more strongly when subjects encounter sad faces compared with happy faces (P < 0.01), and this activation intensity in response to viewing sad faces is notably higher compared with that in subjects in the SCC group (P < 0.001). Similarly, the right striatum (“R. Striatum” graph) is also activated significantly more strongly in response to viewing sad faces in the SCP group compared with the SCC group (P < 0.001). Moreover, in the SCC group, this brain structure is more responsive to happy faces compared with sad faces (P < 0.05). The same applies for the right insula (“R. Insula” graph; P < 0.01). The results reported here are not confounded by nonspecific differences in neural reactivity, neural coupling, or resting perfusion in these brain regions. The black lines represent mean ± SD. More details on the cluster-corrected results of the whole-brain analysis are provided in SI Appendix, Fig. S4. RA, right amygdala; RI, right insula; RS, right striatum. *P < 0.05; **P < 0.01; ***P < 0.001.

