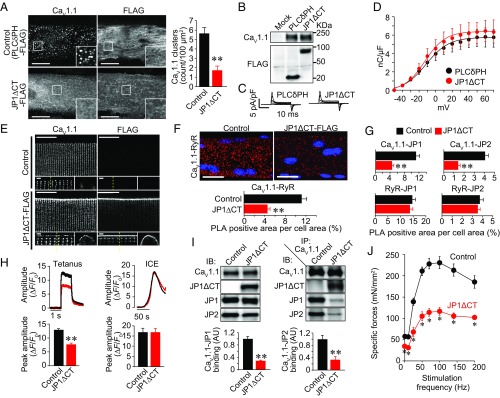
Fig. 5.
Expression of JP1ΔCT-FLAG decreases the coupling of CaV1.1–RyR and the specific force of the TA muscle in living mice. (A) GLT myotubes were cotransfected with GFP-CaV1.1 and PLCδPH-FLAG (negative control) or JP1ΔCT-FLAG. GFP-CaV1.1 and FLAG-tag were detected with antibodies against GFP and FLAG, respectively. (Scale bar: 20 µm.) The graph represents the number of CaV1.1 clusters in the myotubes. Mean ± SEM (n = 20). **P < 0.01 vs. control. (B) Expression of CaV1.1 and PLCδPH-FLAG or JP1ΔCT-FLAG in GLT myotubes. (C) Representative traces of LTCC gating currents in GLT myotubes. (D) Gating charge density–voltage relationships of LTCCs in GLT myotubes. Mean ± SEM (n = 5). (E) Effect of JP1ΔCT-FLAG expression on localization of CaV1.1 in FDB fibers. CaV1.1 and JP1ΔCT-FLAG in isolated FDB fibers were detected with antibodies against CaV1.1 and FLAG, respectively. (Scale bar: 20 µm.) High-magnification images of an x–y plane and an x–z plane are shown in the Lower Left and Lower Right panels, respectively. The dotted lines in the x–y plane indicate the position at which the x–z image was constructed. (Scale bar: 1 µm.) (F) Representative images and quantification of CaV1.1–RyR association detected by PLA assay. The collapsed z-stack images of FDB fibers are shown. (Scale bar: 20 µm.) Graph: normalized PLA-positive area (40 fibers from four animals for each group were analyzed). **P < 0.01 compared with control. (G) Normalized PLA-positive area analyzed with various antibody combinations (40 fibers from four animals for each group were analyzed). (H) Ca2+ transients of isolated FDB fibers induced by electrical stimulation or Ca2+-releasing mixture treatment. Action potentials were elicited by electrical stimulation with 1-ms pulses of 50 V at 100 Hz. The SR Ca2+ content was assessed by applying the Ca2+ release mixture (ICE). The peak fluorescence amplitudes of Ca2+ transients elicited by tetanic and ICE stimulation were quantified in 74–80 and 19–24 fibers from four animals, respectively. Mean ± SEM. **P < 0.01. (I) Immunoprecipitation and immunoblotting of TA muscle proteins. The Left panel represents immunoblotting using microsomes from control- and JP1ΔCT-expressed TA muscle. The Right panel represents immunoblotting using proteins that coimmunoprecipitated with anti-CaV1.1 antibody. The graphs represent the amounts of coimmunoprecipitated JP1 and JP2 normalized by expression in microsomes (n = 4). AU, arbitrary unit. Mean ± SEM. **P < 0.01. (J) Frequency-specific force relationship of TA muscles. Twenty days after injection of control or JP1ΔCT-FLAG-AAV, muscle contractile force was assayed in vivo. The TA muscles were electrically stimulated with 1-ms pulses of predetermined supramaximal voltage at 1–200 Hz. Mean ± SEM (n = 6). *P < 0.01 vs. control.

