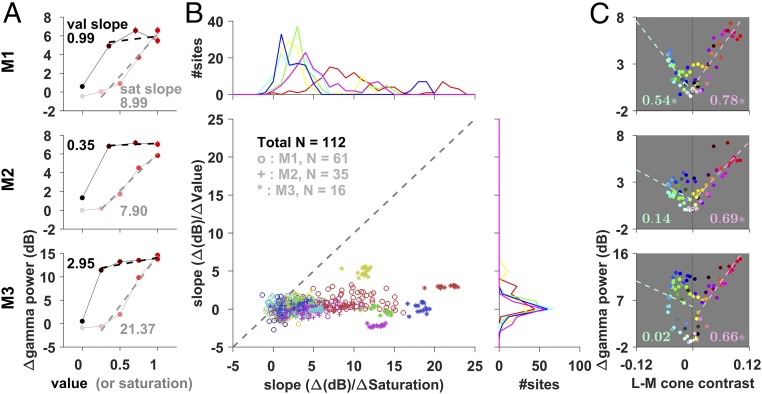
Fig. 4.
Effects of saturation, value, and L−M cone contrast. (A) Average change in gamma power for varying levels of saturation and value for 0° hue stimulus. The dashed lines show the linear fit for the non-0 saturation (or value) conditions, and their slope is indicated alongside. Note that although the black and white stimuli are shown in the plots at 0 value and 0 saturation levels, respectively, they are not used to estimate the slopes, since chromatic information is completely lost for these colors. (B) Scatterplot of the slopes with saturation and value variations. Each data point represents an electrode. The marginals (Top and Right) show the distribution of slopes across electrodes separately for saturation and value variations. Color indicates the hue used. (C) L−M cone contrast with respect to the adapting gray (details in Materials and Methods) and the corresponding change in gamma power for the different stimuli (shown in the corresponding color; data point for gray shown as an open black circle) for the three monkeys. The numbers indicate the goodness-of-fit (R2) values for linear regression between the change in gamma power and positive (shown in red, at a precision of two decimal places) and negative (in green) L−M cone contrast values; the dashed line represents the corresponding line of regression. Asterisks indicate significant R2 values (P < 0.01).

